Data Analyticsintermediate
SQL Server and Power BI for End-to-End Sales Data Analysis and Visualization
This course empowers learners to conduct comprehensive sales data analysis using SQL Server and Power BI. Participants will learn to clean, transform, model, and visualize real-world sales data, culminating in the creation of interactive and insightful Power BI reports.
24 lectures
What You Will Learn
Mastering the installation and configuration of SQL Server and SSMS.
Implementing data import techniques from various sources into SQL Server and Power BI.
Applying data profiling and cleaning methods to ensure data quality and consistency.
Building calculated columns and custom measures using DAX in Power BI.
Designing interactive Power BI reports with effective visualizations to communicate insights.
Analyzing sales, returns, and inventory data to identify trends and patterns.
Optimizing Power BI reports for performance and accessibility.
System Architecture
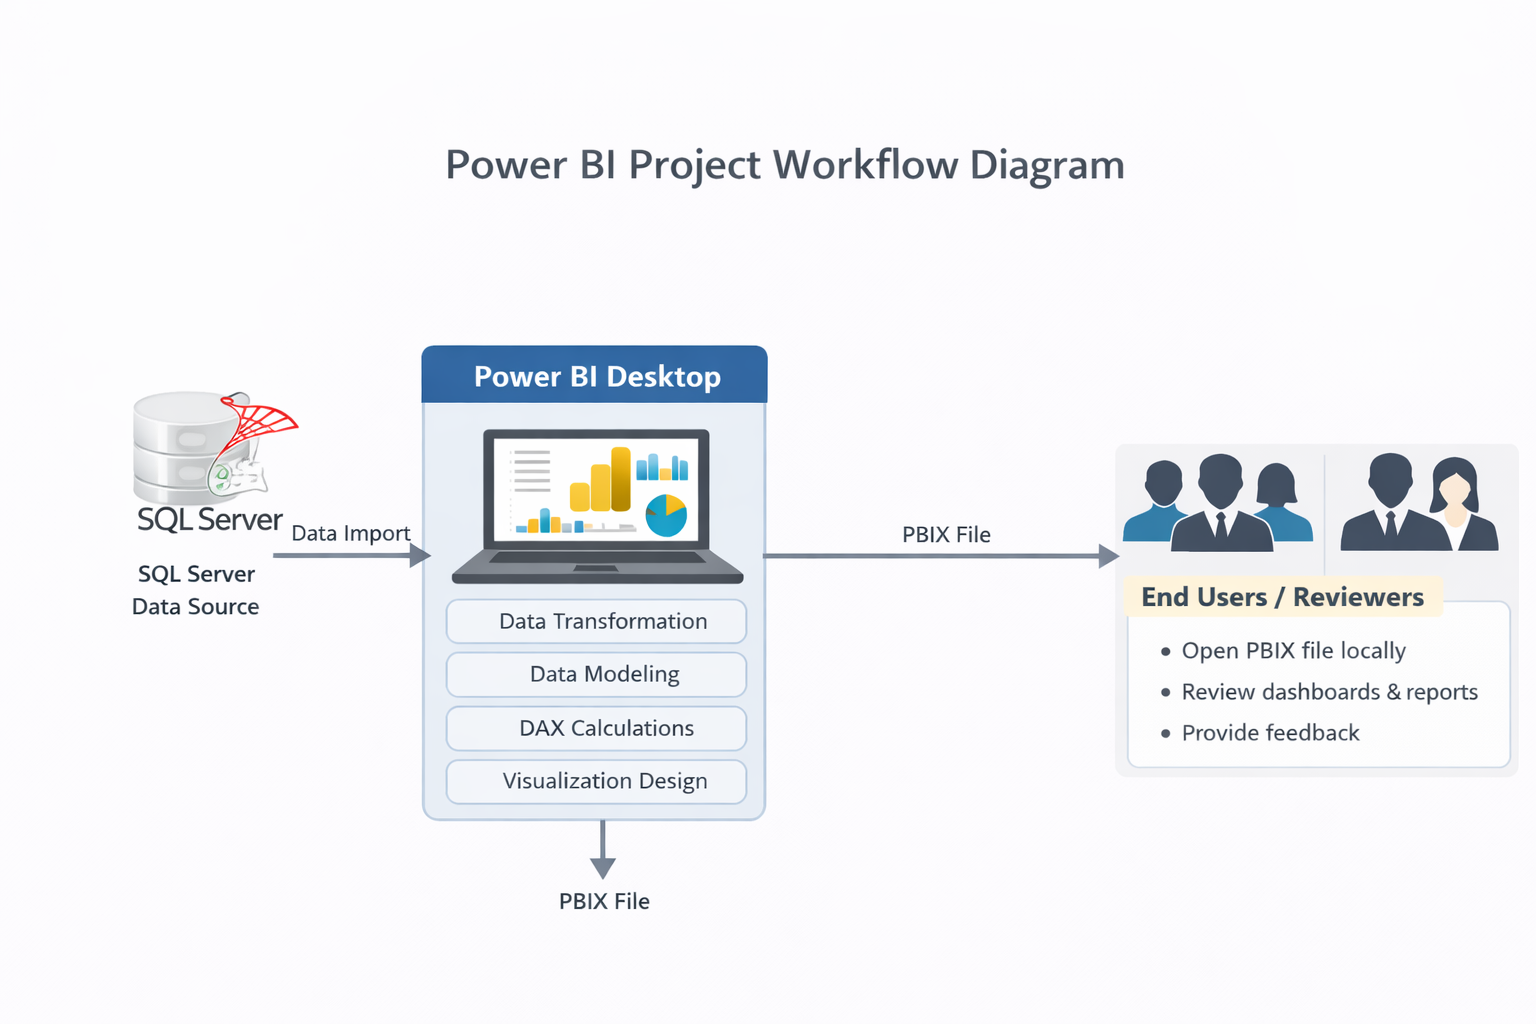
High-level architecture overview of the SQL Server and Power BI for End-to-End Sales Data Analysis and Visualization .
What You'll Build
- A fully functional SQL Server database populated with sales data.
- An interactive Power BI report with multiple pages analyzing sales, returns, and inventory.
- Key Performance Indicators (KPIs) to track total sales, average order value, and units sold.
- Visualizations that showcase revenue by brand, returns by reason, and inventory levels.
- A comprehensive data analysis project suitable for professional and academic portfolios.
Project Instructor

Jayant Topnani
4+ years exp
Premium
One Subscription. 40+ Projects. Unlimited Access.
AccessMobile & Web

Krish AI
Beta