
Prometheus metrics
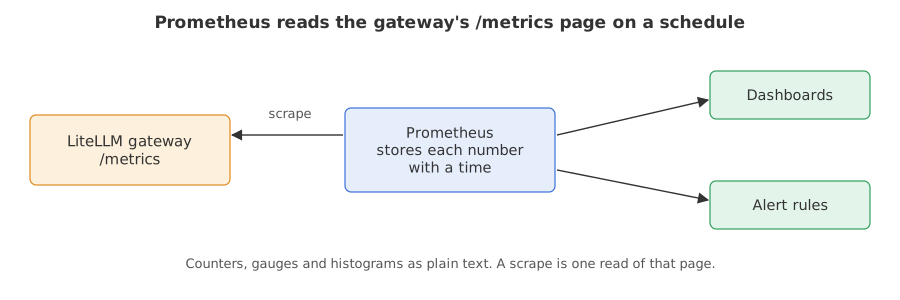
Prometheus metrics are numbers that the gateway publishes as plain text at /metrics, so that a monitoring server called Prometheus can read them on a schedule and keep their history.
Last updated: 12 Oct, 2026 · LiteLLM 1.105
A health check, as in Health checks, says whether the gateway answers right now. Metrics keep the history: how many requests came in, how many failed, how long they took and what they cost, split by model. Prometheus is an open-source system that reads such a page every few seconds and stores each number with a timestamp. The Prometheus metrics page says the gateway exposes a /metrics endpoint for Prometheus to poll.
Installing the metrics package
The metrics callback needs the prometheus_client package. The docs say to install version 0.20.0. In LiteLLM 1.105 the command litellm[proxy] does not install it: the package's metadata lists it under a different extra, proxy-runtime. A gateway configured with the callback but without the package stopped while starting, with ModuleNotFoundError: No module named 'prometheus_client'. Install it first.
pip install "prometheus-client==0.20.0"Syntax: one line in the config switches the metrics on.
litellm_settings:
  callbacks: ["prometheus"]    # publish metrics at /metrics
Writing the helper that starts a gateway
ops.py starts the litellm command, waits until it answers, and stops it in a finally block. call() sends a request and returns the status, body and headers. chat() sends one chat request.
from pathlib import Path
import sys

Path("ops.py").write_text('''import json
import os
import subprocess
import sys
import time
import urllib.error
import urllib.request
from contextlib import contextmanager

KEY = "sk-gateway-1234"          # the master key written in every config.yaml


@contextmanager
def running(port, env=None):
    """Start the gateway on `port` from config.yaml, wait until it answers, stop it afterwards."""
    litellm = os.path.join(os.path.dirname(sys.executable), "litellm")
    cmd = [litellm, "--config", "config.yaml", "--port", str(port)]
    proc = subprocess.Popen(cmd, env=env, stdout=open("gateway.log", "w"), stderr=subprocess.STDOUT)
    try:
        for _ in range(90):
            if proc.poll() is not None:
                raise RuntimeError("the gateway stopped; read gateway.log")
            try:
                urllib.request.urlopen(f"http://127.0.0.1:{port}/health/liveliness")
                break
            except OSError:
                time.sleep(1)
        yield f"http://127.0.0.1:{port}"
    finally:
        proc.terminate()
        proc.wait(10)


def call(url, path, body=None, key=KEY, headers=None):
    """Send one request. Returns (status, text, headers) and does not raise on 4xx or 5xx."""
    head = dict(headers or {})
    if key:
        head["Authorization"] = f"Bearer {key}"
    if body is not None:
        head["Content-Type"] = "application/json"
    data = json.dumps(body).encode() if body is not None else None
    try:
        reply = urllib.request.urlopen(urllib.request.Request(url + path, data=data, headers=head), timeout=60)
    except urllib.error.HTTPError as error:
        reply = error
    return reply.getcode(), reply.read().decode(), {k.lower(): v for k, v in reply.headers.items()}


def chat(url, model, text="Reply with one word: ok", key=KEY, headers=None, **extra):
    """One chat request. Extra keyword arguments are added to the JSON body."""
    body = {"model": model, "messages": [{"role": "user", "content": text}], "max_tokens": 60, **extra}
    return call(url, "/chat/completions", body, key, headers)
''')
sys.path.insert(0, ".")        # lets the programs below run: from ops import running, call, chat
print("wrote ops.py")wrote ops.py
Reading the scrape
The program starts a gateway with the callback and two models: one that works and one whose key Groq rejects. It sends three chat requests, then reads /metrics twice, once without a key and once with the master key. The page says to pass a key when reading the endpoint, and the installed source's own note on require_auth_for_metrics_endpoint says authentication is on by default.
Printing one gauge as raw text
A scrape is text, one sample per line. Lines that start with # describe a metric. The other lines hold the metric name, its labels in braces and its value. The program prints every line of one gauge, litellm_deployment_state, untouched.
Picking series with a small parser
The gateway's metrics carry many labels, so the raw lines are long. series() reads the labels with a regular expression and prints only the ones asked for, with the value at the end of the line.
import re
from pathlib import Path
from ops import running, call, chat

Path("config.yaml").write_text("""model_list:
  - model_name: fast
    litellm_params:
      model: groq/openai/gpt-oss-20b
      api_key: os.environ/GROQ_API_KEY
    model_info:
      id: fast-20b
  - model_name: broken
    litellm_params:
      model: groq/openai/gpt-oss-120b
      api_key: gsk_not_a_real_key
    model_info:
      id: broken-120b
litellm_settings:
  callbacks: ["prometheus"]
general_settings:
  master_key: sk-gateway-1234
""")

with running(4711) as url:
    print([chat(url, model)[0] for model in ["fast", "fast", "broken"]])
    print("scrape without a key:", call(url, "/metrics", key=None)[0])
    text = call(url, "/metrics")[1]                      # the scrape, with the master key

for line in text.splitlines():                           # the raw text, for one gauge
    if "litellm_deployment_state" in line:
        print(line)

def series(name, *labels):                               # print chosen labels and the value
    for line in text.splitlines():
        if line.startswith(name + "{"):
            found = dict(re.findall(r'(\w+)="([^"]*)"', line))
            print(name, {k: found[k] for k in labels}, line.rsplit(" ", 1)[1])

series("litellm_proxy_total_requests_metric_total", "requested_model", "status_code")
series("litellm_proxy_failed_requests_metric_total", "requested_model", "exception_status")
series("litellm_total_tokens_metric_total", "requested_model")
series("litellm_request_total_latency_metric_count", "requested_model")
series("litellm_request_total_latency_metric_sum", "requested_model")[200, 200, 401]
scrape without a key: 401
# HELP litellm_deployment_state LLM Deployment Analytics - The state of the deployment: 0 = healthy, 1 = partial outage, 2 = complete outage
# TYPE litellm_deployment_state gauge
litellm_deployment_state{api_base="https://api.groq.com/openai/v1/chat/completions",api_provider="groq",litellm_model_name="openai/gpt-oss-20b",model_id="fast-20b"} 0.0
litellm_deployment_state{api_base="",api_provider="groq",litellm_model_name="broken",model_id="broken-120b"} 2.0
litellm_proxy_total_requests_metric_total {'requested_model': 'fast', 'status_code': '200'} 2.0
litellm_proxy_total_requests_metric_total {'requested_model': 'broken', 'status_code': '401'} 1.0
litellm_proxy_total_requests_metric_total {'requested_model': '', 'status_code': 'None'} 1.0
litellm_proxy_failed_requests_metric_total {'requested_model': 'broken', 'exception_status': '401'} 1.0
litellm_proxy_failed_requests_metric_total {'requested_model': '', 'exception_status': 'None'} 1.0
litellm_total_tokens_metric_total {'requested_model': 'fast'} 216.0
litellm_request_total_latency_metric_count {'requested_model': 'fast'} 2.0
litellm_request_total_latency_metric_sum {'requested_model': 'fast'} 1.1008537541503907Reading counters, gauges and histograms
- The statuses are
[200, 200, 401]. Two requests reached the working model. One reached the model with the rejected key. - The scrape without a key answered 401. In 1.105
/metricsasks for a key. A Prometheus server must send one, or the settingrequire_auth_for_metrics_endpoint: falseunderlitellm_settingsturns the check off. - The first lines are the raw gauge.
HELPis the metric's description andTYPEsays it is a gauge. The docs define the value as 0 for healthy, 1 for a partial outage and 2 for a complete outage. The deployment that had failed a moment earlier shows 2.0 and the working one shows 0.0. - Counters end in
_totaland only go up.litellm_proxy_total_requests_metric_totalcounted two requests with status 200 and one with 401 for the chat route. The row with an emptyrequested_modelis the unauthenticated scrape: the gateway counts its own failed calls too. - A histogram is three series.
_countis how many requests were timed and_sumis their total seconds. Divide the sum by the count for the average latency in seconds.
Scraping from Prometheus
Prometheus reads targets from its own configuration file. Because the gateway wants a key, the scrape job sends it as a bearer token. This is Prometheus's configuration format, not LiteLLM's.
scrape_configs:
  - job_name: litellm
    metrics_path: /metrics
    authorization:
      type: Bearer
      credentials: sk-gateway-1234
    static_configs:
      - targets: ["litellm:4000"]
Once the numbers are in Prometheus, a query turns them into an answer. The docs give this query for the 95th percentile of end-to-end request latency over five minutes, which is the time under which 95 of 100 requests finished.
histogram_quantile(0.95, sum by (le) (rate(litellm_request_total_latency_metric_bucket[5m])))Moving the scrape to its own port
The docs say that by default the gateway renders /metrics on the same port and workers that serve requests, so a heavy scrape can slow them. From v1.101.0 the page describes a dedicated process: start the gateway with --prometheus_metrics_port and point Prometheus at that port. The flag exists in the installed command. The page also warns that this port does not use virtual-key authentication, so it must not be exposed publicly. Not run here.
litellm --config config.yaml --num_workers 4 --prometheus_metrics_port 4001Counter vs gauge vs histogram
| Counter | Gauge | Histogram | |
|---|---|---|---|
| Moves | Only up | Up and down | Each timed request adds to a count, a sum and buckets |
| Example here | litellm_proxy_total_requests_metric_total | litellm_deployment_state | litellm_request_total_latency_metric |
| Answers | How many so far? Use rate() for per second | What is it now? | How long did requests take? Use a quantile |
Where you use Prometheus metrics
- Spotting a failing model. A rise in
litellm_proxy_failed_requests_metric_totalfor onerequested_modelshows up before a user reports it. - Latency targets. The docs name
litellm_request_total_latency_metricas the one to use for latency SLOs and alerts. - Spend per team or key. The docs list
litellm_spend_metricwith labels for the key, team and user, so a dashboard can chart cost by owner.
end_user on Prometheus by default, to keep the number of series down, and that turning it on is capped. Add labels only for questions you will ask.Related
- Previous: Health checks
- Next: Alerting
- See also: Observability: watching every call for the callbacks and logs that sit beside metrics
- Reference: Prometheus metrics in the LiteLLM docs
- Add
require_auth_for_metrics_endpoint: falseunderlitellm_settingsin the config, start the gateway again, and scrape without a key. The status changes from 401 to 200. - Print the series
litellm_input_tokens_metric_totalandlitellm_output_tokens_metric_totalforfast, and compare them withlitellm_total_tokens_metric_total. - Send five more requests to
fastbefore the scrape, and watch the request count and the latency_countgrow together.
You understood something today that you didn't yesterday.