
Reading evaluation results
Evaluation results are the table of scores a run produces, one row per golden and one column per metric, read cell by cell to find which part of a RAG app to fix.
Last updated: 09 Oct, 2026 · pandas 3.0
The five lessons from Faithfulness to Answer correctness each produced one number for one sample. A real run produces a grid of them. The grid is where evaluation pays off: it turns "the bot gave a bad answer" into "this question, this metric, this part of the pipeline".
This part of the video starts at 2:40:40. It opens the Results tab of the TechNest app after the second evaluation run has finished; the metric focus column it reads from is a label, and every golden is scored on all five metrics.
Reading the Results screen of the video's run
The screen has three layers. On top are the overall averages, one per metric, each with a coloured dot. Under them is the per-golden table: five rows, one for each golden, with its five scores. At the bottom are the per-golden details: the app's answer, the retrieved chunks and the reference for one golden side by side, and a button that downloads the whole result as JSON.
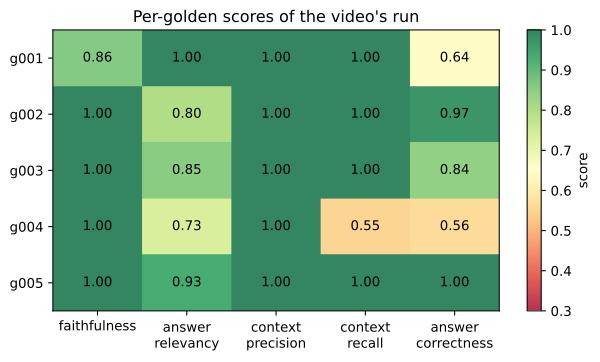
The video reads the first row aloud: the return-policy golden has a faithfulness of 0.86, a little low, while its answer relevancy and context precision are good. Then it asks the viewers a question: for which golden is the app lacking, and in which aspect? The table below answers it.
Rebuilding the per-golden table
The scores are typed in from the screen as data. They are the video's run, made with its judge and its embedding model, not a new run.
import matplotlib.pyplot as plt
import pandas as pd

# per-golden scores read off the Results screen of the video's second run (typed in, not re-run)
scores = pd.DataFrame(
    {"faithfulness":       [0.86, 1.00, 1.00, 1.00, 1.00],
     "answer_relevancy":   [1.00, 0.80, 0.85, 0.73, 0.93],
     "context_precision":  [1.00, 1.00, 1.00, 1.00, 1.00],
     "context_recall":     [1.00, 1.00, 1.00, 0.55, 1.00],
     "answer_correctness": [0.64, 0.97, 0.84, 0.56, 1.00]},
    index=["g001", "g002", "g003", "g004", "g005"],
)

print(scores.to_string())
print()
print("average per metric:")
print(scores.mean().round(2).to_string())
print()
print("cells under 0.75:")
for golden, row in scores.iterrows():
    for metric, value in row.items():
        if value < 0.75:
            print(f"  {golden}  {metric:<18}  {value:.2f}")

fig, ax = plt.subplots(figsize=(7.5, 3.8))
image = ax.imshow(scores.values, cmap="RdYlGn", vmin=0.3, vmax=1.0, alpha=0.8, aspect="auto")
ax.set_xticks(range(5), [name.replace("_", "\n") for name in scores.columns])
ax.set_yticks(range(5), scores.index)
for r in range(5):
    for c in range(5):
        ax.text(c, r, f"{scores.values[r, c]:.2f}", ha="center", va="center")
ax.set_title("Per-golden scores of the video's run")
fig.colorbar(image, label="score")
plt.show()faithfulness answer_relevancy context_precision context_recall answer_correctness g001 0.86 1.00 1.0 1.00 0.64 g002 1.00 0.80 1.0 1.00 0.97 g003 1.00 0.85 1.0 1.00 0.84 g004 1.00 0.73 1.0 0.55 0.56 g005 1.00 0.93 1.0 1.00 1.00 average per metric: faithfulness 0.97 answer_relevancy 0.86 context_precision 1.00 context_recall 0.91 answer_correctness 0.80 cells under 0.75: g001 answer_correctness 0.64 g004 answer_relevancy 0.73 g004 context_recall 0.55 g004 answer_correctness 0.56
What the table says about the app
- The averages are 0.97, 0.86, 1.00, 0.91 and 0.80, the five numbers at the top of the screen. All five get a green dot there.
- Four cells are under 0.75, and three of them are in one row. The golden g004 has a context recall of 0.55, an answer correctness of 0.56 and an answer relevancy of 0.73. That answers the video's question: the app is lacking on g004, and the aspect is context recall.
- g004 is the only question that draws on two catalog entries: "What are TechNest's shipping options and how long do returns take to process?". Its reference needs facts from the shipping policy and from the return policy. A low context recall says the context the judge saw did not cover that reference, and an answer cannot be correct about facts the generator never received, so the low answer correctness follows.
- g001 fails for a different reason. Its context recall is 1.00, so retrieval did its job; the 0.64 on answer correctness comes from the answer itself differing from the reference.
- Context precision is 1.00 in every row. The app scores it on the first two chunks only, and a list that short hides ranking problems, as Context precision showed.
- The average hides the weak cell. Context recall averages 0.91, which looks healthy, while one golden sits at 0.55.
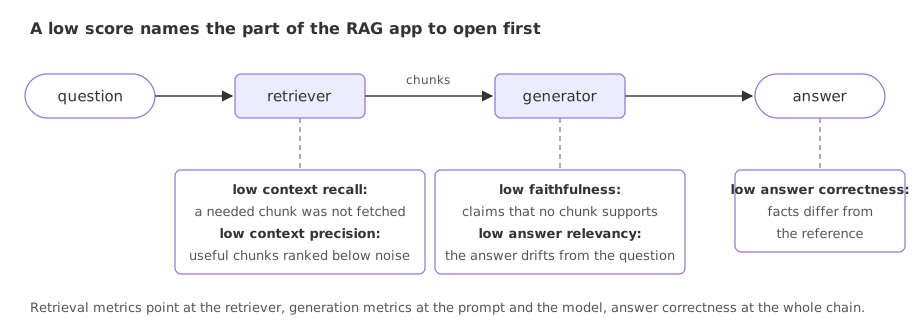
Each low cell names a part of the pipeline to open first:
Reading the coloured dots
The dots on the screen come from the app's own code, not from RAGAS: green for a score of 0.75 or more, yellow from 0.50, red below that. The metric cards earlier in the video use other lines, a pass mark of 0.8 for faithfulness and 0.7 for context precision and context recall. RAGAS returns numbers and sets no pass mark for these five metrics. Where the line goes is a decision, and the next two examples show what it should rest on.
Comparing two runs of the same goldens
The video shows the Results screen twice: once early on, from a first run, and once at the end, after a second run of the same app on the same five goldens. Faithfulness is the only column that differs.
import pandas as pd

# faithfulness of the same five goldens in the two runs the video shows (typed in from the Results screens);
# the other four metrics have the same values in both runs
runs = pd.DataFrame(
    {"first run": [0.86, 1.00, 0.67, 1.00, 1.00], "second run": [0.86, 1.00, 1.00, 1.00, 1.00]},
    index=["g001", "g002", "g003", "g004", "g005"],
)
runs["change"] = runs["second run"] - runs["first run"]
print(runs.round(2).to_string())
print("averages:", round(runs["first run"].mean(), 2), "and", round(runs["second run"].mean(), 2))
for pass_mark in (0.8, 0.7, 0.6):
    failing = [int((runs[run] < pass_mark).sum()) for run in ("first run", "second run")]
print(f"pass mark {pass_mark}: failing goldens {failing[0]} in the first run, {failing[1]} in the second")first run second run change g001 0.86 0.86 0.00 g002 1.00 1.00 0.00 g003 0.67 1.00 0.33 g004 1.00 1.00 0.00 g005 1.00 1.00 0.00 averages: 0.91 and 0.97 pass mark 0.8: failing goldens 1 in the first run, 0 in the second pass mark 0.7: failing goldens 1 in the first run, 0 in the second pass mark 0.6: failing goldens 0 in the first run, 0 in the second
- One cell moved by 0.33. The battery-life golden g003 scored 0.67 in the first run and 1.00 in the second. No other faithfulness value changed.
- The average moved from 0.91 to 0.97 because of that one cell.
- A pass mark of 0.8 or 0.7 fails one golden in the first run and none in the second. A mark of 0.6 passes both. The model's answer and the judge's verdicts both vary from run to run, so a single run near the line is weak evidence.
- A pass mark needs a margin. Run the baseline more than once and keep the mark below the lowest score you see for goldens you know are fine.
Setting a pass mark from a baseline and known-bad samples
A pass mark has to do two jobs: let the answers you know are good through, and stop the ones you know are bad. That needs both kinds of sample. The baseline below is the video's run. The known-bad scores come from the notebook in the video's repo, which scores one deliberately wrong sample per metric with the same judge model; they are its saved outputs.
import pandas as pd

# per-golden scores read off the Results screen of the video's second run (typed in, not re-run)
scores = pd.DataFrame(
    {"faithfulness":       [0.86, 1.00, 1.00, 1.00, 1.00],
     "answer_relevancy":   [1.00, 0.80, 0.85, 0.73, 0.93],
     "context_precision":  [1.00, 1.00, 1.00, 1.00, 1.00],
     "context_recall":     [1.00, 1.00, 1.00, 0.55, 1.00],
     "answer_correctness": [0.64, 0.97, 0.84, 0.56, 1.00]},
    index=["g001", "g002", "g003", "g004", "g005"],
)

# the deliberately wrong sample of each experiment in the notebook of the video's repo (its saved output)
known_bad = pd.Series({"faithfulness": 0.00, "answer_relevancy": 0.30, "context_precision": 0.33,
                       "context_recall": 0.00, "answer_correctness": 0.59})

lowest_good = scores.min()  # the weakest golden of the baseline run, per metric
for metric in scores.columns:
    bad, good = known_bad[metric], lowest_good[metric]
    if good > bad:
        verdict = f"a pass mark between {bad:.2f} and {good:.2f} separates them, midpoint {(bad + good) / 2:.2f}"
    else:
        verdict = "no pass mark separates them"
print(f"{metric:<18} known bad {bad:.2f} lowest golden {good:.2f} {verdict}")faithfulness known bad 0.00 lowest golden 0.86 a pass mark between 0.00 and 0.86 separates them, midpoint 0.43 answer_relevancy known bad 0.30 lowest golden 0.73 a pass mark between 0.30 and 0.73 separates them, midpoint 0.52 context_precision known bad 0.33 lowest golden 1.00 a pass mark between 0.33 and 1.00 separates them, midpoint 0.67 context_recall known bad 0.00 lowest golden 0.55 a pass mark between 0.00 and 0.55 separates them, midpoint 0.28 answer_correctness known bad 0.59 lowest golden 0.56 no pass mark separates them
- Four metrics leave room for a line. For faithfulness any mark between 0.00 and 0.86 separates the wrong sample from the weakest golden; for answer relevancy the room is 0.30 to 0.73.
- The room differs per metric, so one fixed line for all five, such as 0.75, is a convenience and not a finding. At 0.75 the baseline itself has four failing cells.
- Answer correctness leaves no room. The notebook's wrong answer scored 0.59, above the baseline's g004 at 0.56. No pass mark lets every golden through and stops that sample. The fix is not a cleverer number: it is a look at the goldens and their references, a stronger judge, or a heavier weight on the factual part.
- Two samples per metric are a start. The same check on more goldens and more known-bad answers gives a line you can defend.
Average vs per-golden score
| Average per metric | Per-golden score | |
|---|---|---|
| Answers the question | How is the app doing on this metric overall? | Which question fails, and on which metric? |
| In the video's run | Context recall 0.91 | g004 context recall 0.55 |
| Use it for | A trend across runs, a release decision | Finding what to fix |
| Weak point | Hides one bad golden among good ones | One judge verdict can move a cell a lot |
Where you use evaluation results
- Deciding what to work on. A low context recall sends you to the retriever, a low faithfulness to the prompt and the model.
- Before and after a change. Keep the results file of each run; the difference between two runs is the effect of the change, within the noise of the judge.
- Turning a complaint into a test. When a deployed bot answers a question badly, the video's advice is to add that question as a new golden, so the next run shows whether it is fixed.
Related
- Previous: Answer correctness
- Next: Evals in CI
- In the table example, change
0.75to0.8in the loop: no new cell appears, because the next lowest scores are 0.80 and above. - In the same example, add
print(scores.mean(axis=1).round(2).to_string()): the row averages are 0.90, 0.95, 0.94, 0.77 and 0.99, and g004 is the lowest. - In the two-run example, change the pass marks to
(0.9, 0.86): at 0.9 two goldens fail in the first run and one in the second, and at 0.86 one fails in the first run and none in the second.
This is what real progress feels like.