
Load testing with Locust
Locust is an open-source load testing tool in which you describe what a user does in Python, and it runs many simulated users against your system at once and reports response times and failures.
Last updated: 09 Oct, 2026 · Locust 2.44 (in the video), NumPy 2.5
The API from Deploying on Amazon EKS answers one question in about 23 seconds. That says nothing about ten people asking at once. A load test finds out before real users do, and for an LLM application it also shows where the time goes and what each test costs.
This part of the video starts at 7:26:02. The test on screen runs 10 users. While it runs, the pod list stays at two rag-api pods and the autoscaler row reads about 40% CPU against a target of 70%.
The locustfile: one user class, three tasks
A Locust test is a Python file. The video starts it with uv run locust -f locustfile.py and fills in the number of users on Locust's web page on port 8089.
Shown as it ran in the video, not run here: it needs the locust package and a deployed API to aim at. The host name of the load balancer is replaced by <your-load-balancer>.
from locust import HttpUser, task, between


class RAGApiUser(HttpUser):
    """Simulates a user asking questions to the RAG API."""

    # Target the EKS LoadBalancer URL
    host = "http://<your-load-balancer>"

    wait_time = between(0, 0)

    @task(3)
    def ask_agentic_transformer(self):
        """Ask about transformer architecture (most common query)."""
        self.client.post(
            "/api/v1/ask-agentic",
            json={"query": "What is transformer architecture?"},
            headers={"Content-Type": "application/json"},
        )

    @task(2)
    def ask_agentic_attention(self):
        """Ask about attention mechanism."""
        self.client.post(
            "/api/v1/ask-agentic",
            json={"query": "Explain the attention mechanism in deep learning"},
            headers={"Content-Type": "application/json"},
        )

    @task(1)
    def ask_agentic_rl(self):
        """Ask about reinforcement learning."""
        self.client.post(
            "/api/v1/ask-agentic",
            json={"query": "What is policy gradient in reinforcement learning?"},
            headers={"Content-Type": "application/json"},
)HttpUseris one simulated user with its own HTTP client. Locust creates as many as you ask for.@task(3),@task(2),@task(1)are weights. Each time a user is free it picks one task at random, so the three questions are asked about 3, 2 and 1 times in every 6.wait_time = between(0, 0)is the pause between two tasks of the same user, here zero. A user sends its next question the moment an answer arrives.- What counts as a failure is an HTTP status of 400 or above. A reply with status 200 that carries a refusal or an empty answer counts as a success in this file.
The two numbers you type into Locust
The start form asks for Number of users (peak concurrency) and Ramp up (users started/second). The video runs three tests with 10, 20 and 50 users, each with a ramp of 2. The same test without the web page is locust -f locustfile.py --headless -u 10 -r 2 -t 60s: -u users, -r spawn rate, -t run time.
The terminal in the video shows Locust 2.44.0 starting its web interface on port 8089. For the first test the log reads "Ramping to 10 users at a rate of 2.00 per second" at 22:15:31 and "All users spawned: {"RAGApiUser": 10} (10 total users)" at 22:15:35.
Users are not requests per second
"10 users" does not mean 10 requests each second. Each user sends one request, waits for the answer, and only then sends the next. This is a closed loop: the system's own speed limits how fast requests arrive.
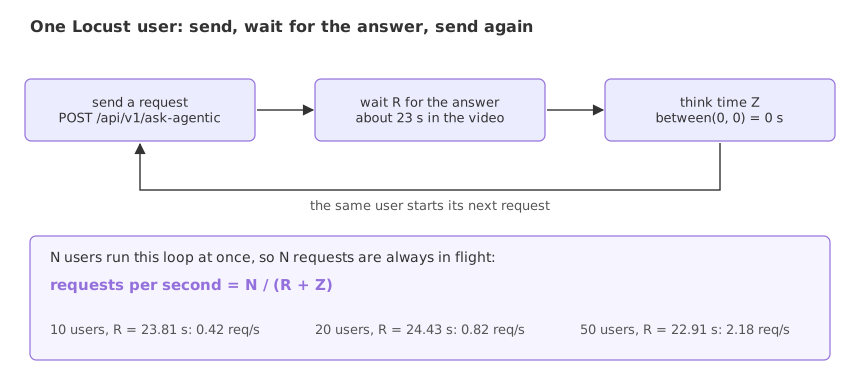
The example applies the formula to the averages on the video's Locust screen, then computes the ramp-up time and checks the task weights with a seeded random draw.
import random
from collections import Counter

# (users, average response time in ms, requests per second on screen) from the Locust table
tests = [(10, 23811.49, 0.37), (20, 24428.55, 0.76), (50, 22914.86, 1.82)]
print("users  response  N / R       on screen")
for users, avg_ms, shown in tests:
    r = avg_ms / 1000                       # seconds one user waits for one answer
    print(f"{users:>5}  {r:6.2f} s  {users / r:.2f} req/s  {shown} req/s")

print("10 users who also pause 5 s:", round(10 / (23.81 + 5), 2), "req/s")

print("ramp-up = users / spawn rate, at 2 users per second")
for users in (10, 20, 50):
    print(f"  {users} users: {users / 2:.0f} s")

weights = {"ask_agentic_transformer": 3, "ask_agentic_attention": 2, "ask_agentic_rl": 1}
rng = random.Random(7)
picks = Counter(rng.choices(list(weights), weights=list(weights.values()), k=6000))
print("task weights 3 : 2 : 1 over 6000 simulated picks")
for name, w in weights.items():
print(f" {name:24} expected {w / 6:.1%} picked {picks[name] / 6000:.1%}")users response N / R on screen 10 23.81 s 0.42 req/s 0.37 req/s 20 24.43 s 0.82 req/s 0.76 req/s 50 22.91 s 2.18 req/s 1.82 req/s 10 users who also pause 5 s: 0.35 req/s ramp-up = users / spawn rate, at 2 users per second 10 users: 5 s 20 users: 10 s 50 users: 25 s task weights 3 : 2 : 1 over 6000 simulated picks ask_agentic_transformer expected 50.0% picked 51.1% ask_agentic_attention expected 33.3% picked 32.6% ask_agentic_rl expected 16.7% picked 16.3%
What the throughput numbers mean
- 10 users make about 0.42 requests per second, not 10. Locust's own counter read 0.37 at that moment, a little under the formula.
- Throughput grows with the users: 0.82 for 20 and 2.18 for 50, with Locust showing 0.76 and 1.82. The response time stayed near 23 seconds in all three tests, so the pods were not the slow part; the time is spent waiting for the model.
- A pause lowers the load. The same 10 users with a 5 second think time would send 0.35 requests per second.
between(0, 0)is the heaviest load a given number of users can produce. - Ramp-up is users divided by spawn rate: 5, 10 and 25 seconds. The log in the video shows 4 seconds between "Ramping to 10 users" and "All users spawned", one second less, because the first two users start at once.
- The weights hold on average. 6000 simulated picks gave 51.1%, 32.6% and 16.3% against the expected 50.0%, 33.3% and 16.7%.
The results at 10, 20 and 50 users
These are the last rows of the Locust statistics table in each of the three tests, read from the screen. Times are in milliseconds. The code computes the failure share and draws it.
import matplotlib.pyplot as plt

# last Locust row of each test in the video: users, requests, fails, median ms, 95%ile ms, average ms
rows = [(10, 93, 1, 22000, 28000, 23378.44),
        (20, 174, 4, 23000, 28000, 24428.55),
        (50, 629, 186, 23000, 30000, 18508.46)]

print("users  requests  fails  failure share  median   95%ile   average")
shares = []
for users, requests, fails, median, p95, average in rows:
    share = 100 * fails / requests
    shares.append(share)
    print(f"{users:>5}  {requests:>8}  {fails:>5}  {share:>12.2f}%  {median:>6}  {p95:>7}  {average:>8.0f}")

plt.figure(figsize=(6.4, 3.6))
bars = plt.bar([str(r[0]) for r in rows], shares, color=["#2e9e5b", "#e08a1e", "#d64541"], width=0.55)
for bar, share, (_, requests, fails, *_) in zip(bars, shares, rows):
    plt.text(bar.get_x() + bar.get_width() / 2, share + 0.8, f"{fails} of {requests}\n{share:.1f}%", ha="center")
plt.ylim(0, 38)
plt.xlabel("Locust users")
plt.ylabel("failed requests (%)")
plt.title("Failure share at 10, 20 and 50 users")
plt.show()users requests fails failure share median 95%ile average 10 93 1 1.08% 22000 28000 23378 20 174 4 2.30% 23000 28000 24429 50 629 186 29.57% 23000 30000 18508
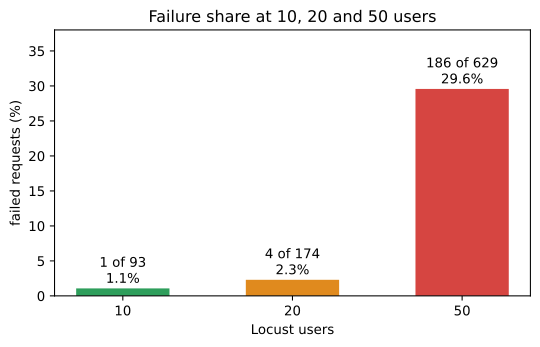
- The failure share is fails divided by requests: 1.08% at 10 users, 2.30% at 20 and 29.57% at 50. Locust's header rounds these to 1%, 2% and 30%.
- The successful requests did not slow down. The median stayed at 22,000 to 23,000 ms and the 95th percentile at 28,000 to 30,000 ms from 10 to 50 users.
- The average fell at 50 users, to 18,508 ms, below the median. That is not good news: 186 requests failed within about a second each, and fast failures pull an average down.
- The share shown during a test is cumulative. In the 20-user test the header read 4% after 72 requests with 3 failures and 2% after 174 requests with 4. The count of failures went up while the percentage went down.
- The cause of the failures is not on screen. The video never opens Locust's Failures tab. The failed requests are fast and small, so they are quick error replies and not timeouts.
Percentiles: p50, p95 and p99
A percentile answers "how slow is the slowest part of my traffic". p50 (the median) is the time half of the requests beat. p95 is the time 95% of them beat, so 1 request in 20 is slower. An average cannot show that.
The video shows Locust's summary table, not each request. To see how percentiles behave, the example builds a simulated log of the same shape with a fixed seed: 200 requests around 23 seconds, a few much slower, a few that fail in about a second.
import matplotlib.pyplot as plt
import numpy as np

rng = np.random.default_rng(42)
n = 200
seconds = rng.normal(23.0, 2.0, n)                 # most calls take about 23 s
slow = rng.random(n) < 0.03                        # 3% wait much longer
seconds[slow] += rng.uniform(25, 60, slow.sum())
failed = rng.random(n) < 0.05                      # 5% fail in about a second
seconds = np.where(failed, rng.uniform(0.6, 1.5, n), seconds)
ms = np.round(seconds * 1000).astype(int)

p50, p95, p99 = (float(np.percentile(ms, p)) for p in (50, 95, 99))
print("requests:", n, "| failed:", int(failed.sum()), f"({failed.mean():.1%})")
print(f"mean {ms.mean():.0f} ms | p50 {p50:.0f} | p95 {p95:.0f} | p99 {p99:.0f} | max {ms.max()}")
print("p95 by method:", {m: round(float(np.percentile(ms, 95, method=m))) for m in ("linear", "lower", "higher")})
print("requests slower than p99:", int((ms > p99).sum()), "of", n)
ok = ms[~failed]
print(f"successful requests only: mean {ok.mean():.0f} ms | p50 {np.percentile(ok, 50):.0f}")

plt.figure(figsize=(7.2, 3.8))
plt.hist(ms / 1000, bins=np.arange(0, 86, 2), color="#bfb6fc", edgecolor="#9370DB")
for value, label, color in [(ms.mean(), "mean", "#d64541"), (p50, "p50", "#2e9e5b"),
                            (p95, "p95", "#e08a1e"), (p99, "p99", "#3a6fd8")]:
    plt.axvline(value / 1000, color=color, linestyle="--", label=f"{label} {value / 1000:.1f} s")
plt.xlabel("response time (s)")
plt.ylabel("requests")
plt.title("200 simulated requests: a few fast failures, a few slow calls")
plt.legend()
plt.show()requests: 200 | failed: 11 (5.5%)
mean 22879 ms | p50 22689 | p95 26314 | p99 78901 | max 83506
p95 by method: {'linear': 26314, 'lower': 26302, 'higher': 26536}
requests slower than p99: 2 of 200
successful requests only: mean 24152 ms | p50 22841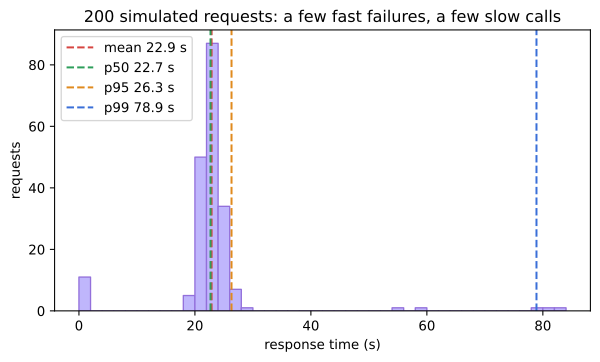
- p50 is 22,689 ms and p95 is 26,314 ms: most requests sit close together. p99 is 78,901 ms, three times the p95, because of the few slow calls.
- The mean, 22,879 ms, hides both tails. The 11 fast failures pull it down and the slow calls push it up. Leave the failures out and the mean of the successful requests is 24,152 ms.
- A percentile needs its method named. NumPy's default interpolates between two neighbours (26,314).
method="lower"gives 26,302 and"higher"gives 26,536 for the same data. - p99 rests on very few requests. Here 2 of 200 are slower than it. In the video's first test of 93 requests, the 99th percentile shown (51,000 ms) is the single slowest request (50,744 ms), rounded.
- Locust rounds before it counts. Its source rounds times of 10 seconds and more to the nearest 1000 ms, which is why its table shows 23000 and 28000 beside an exact average.
Closed-loop vs open-loop load
| Closed loop (this locustfile) | Open loop | |
|---|---|---|
| You fix | The number of users | The number of requests per second |
| When the system slows down | Fewer requests arrive, the test eases off | Requests keep arriving and queue up |
| In Locust | Every user class: a user waits for its answer before its next task, with wait_time = between(a, b) as the pause | Not built in: wait_time = constant_throughput(x) caps a user at x tasks per second, and the user still waits for each answer |
| Models | A fixed group of people each waiting for an answer | Traffic from many independent callers |
Where you use Locust
- Before a launch, to find the number of users at which failures begin, as the 50-user test did here.
- After a change in infrastructure, such as a new instance type or an autoscaler, to compare with the last run.
- In CI in headless mode, with a short run that fails the build when the failure share or the p95 crosses a limit you set.
Related
- Previous: Deploying on Amazon EKS
- Next: Horizontal pod autoscaling (HPA)
- See also: Redis caching for RAG, since a cache changes every number of a load test
- Reference: Writing a locustfile in the Locust docs
- In the throughput example, change the think time from
5to30: 10 users then send 0.19 requests per second, less than half of the 0.42 with no pause. - In the percentile example, change
0.05to0.30so that 30% of requests fail fast: the mean drops by several seconds while p50 moves much less. - In the results example, add a row
(100, 1000, 500, 23000, 30000, 12000.0)and extend the colour list by one colour: the table prints a failure share of 50.00% for it.
This is what real progress feels like.