
Horizontal pod autoscaling (HPA)
The Horizontal Pod Autoscaler (HPA) is a Kubernetes controller that changes the number of pods of a workload so that a measured value, such as average CPU utilisation, stays near a target you set.
Last updated: 09 Oct, 2026 · Kubernetes autoscaling/v2
Load testing with Locust pushed 10, 20 and 50 users at an API that runs as two pods. An autoscaler is supposed to add pods when that happens. The watch output in the video shows what it decided, row by row, and why a decision to add pods is not the same as pods that run.
This part of the video starts at 7:28:38, right after the second test was started with 20 users. The watch output in this clip shows CPU at 63%, 82% and 89% against its 70% target with memory at 55% against 80%, REPLICAS going from 2 to 3, and one new pod, printed twice by the watch, in Pending state.
The HPA manifest
The autoscaler is one more object, applied next to the Deployment it controls.
Shown as it ran in the video, not run here: it needs a Kubernetes cluster with metrics-server installed.
apiVersion: autoscaling/v2
kind: HorizontalPodAutoscaler
metadata:
  name: rag-api-hpa
  namespace: production
spec:
  scaleTargetRef:
    apiVersion: apps/v1
    kind: Deployment
    name: rag-api
  minReplicas: 2
  maxReplicas: 6   # Cap at 6 to control AWS costs
  metrics:
    - type: Resource
      resource:
        name: cpu
        target:
          type: Utilization
          averageUtilization: 70
    - type: Resource
      resource:
        name: memory
        target:
          type: Utilization
          averageUtilization: 80
  behavior:
    scaleDown:
      stabilizationWindowSeconds: 300
      policies:
        - type: Pods
          value: 1             # Remove at most 1 pod per scale-down event
          periodSeconds: 60    # At most once per minute
    scaleUp:
      stabilizationWindowSeconds: 0   # Scale up immediately (no delay)
      policies:
        - type: Pods
          value: 2             # Add up to 2 pods at a time
periodSeconds: 60scaleTargetRefnames what to scale: the Deploymentrag-api.minReplicasandmaxReplicasfence the answer between 2 and 6 pods, whatever the load.metricslists two targets: average CPU at 70% and average memory at 80%, each as a share of the pod's request. The autoscaler computes a pod count for each metric and takes the larger.behaviorslows the changes: at most 2 pods added per minute, and on the way down a 300 second wait, then 1 pod removed per minute.
kubectl get hpa -n production -wNAME REFERENCE TARGETS MINPODS MAXPODS REPLICAS AGE rag-api-hpa Deployment/rag-api cpu: 63%/70%, memory: 55%/80% 2 6 3 4h1m rag-api-hpa Deployment/rag-api cpu: 82%/70%, memory: 55%/80% 2 6 3 4h1m rag-api-hpa Deployment/rag-api cpu: 89%/70%, memory: 55%/80% 2 6 3 4h1m
The replica rule
The controller wakes up at a fixed interval, 15 seconds by default, reads each metric and applies one formula per metric. The video reads the result off the watch output; the code below applies the documented rule to the same rows.
Two details decide most real cases. First, a tolerance: when the ratio of value to target is within 0.1 of 1.0, the default, nothing changes. With a 70% target that is a quiet band from 63% to 77%. Second, the result is clamped to the minimum and the maximum.
The rule in a few lines of Python
import math

ratio = 89 / 70                    # cpu reading / cpu target
if abs(ratio - 1) <= 0.10:         # inside the tolerance band: leave it
    desired = 2
else:
desired = math.ceil(2 * ratio) # 2 pods running nowimport math
def desired(current, value, target, tolerance=0.10):
"""One metric: no change inside the tolerance band, else ceil(current * value / target)."""
ratio = value / target
if abs(ratio - 1) <= tolerance:
return current
return math.ceil(current * ratio)
def hpa(current, cpu, memory, low=2, high=6):
"""rag-api-hpa: cpu target 70, memory target 80, the larger answer wins, kept in 2..6."""
by_cpu, by_memory = desired(current, cpu, 70), desired(current, memory, 80)
return by_cpu, by_memory, max(low, min(high, max(by_cpu, by_memory)))
print("rows from kubectl get hpa -w (2 replicas running)")
for label, cpu, memory in [("idle", 3, 52), ("10 users", 40, 53), ("10 users, peak", 52, 54), ("after the stop", 10, 54)]:
by_cpu, by_memory, final = hpa(2, cpu, memory)
print(f" {label:15} cpu {cpu:>2}% -> {by_cpu} memory {memory}% -> {by_memory} replicas {final}")
print("cpu reading that moves 2 replicas (target 70%)")
for cpu in (63, 76, 77, 105, 106, 140, 141, 176, 300):
by_cpu, _, final = hpa(2, cpu, 54)
print(f" cpu {cpu:>3}% ratio {cpu / 70:.3f} formula {by_cpu} replicas {final}")
print("what the percentages are a share of")
print(f" cpu 89% of the 500m request = {0.89 * 500:.0f}m (the limit is 2000m)")
print(f" memory 56% of the 6Gi request = {0.56 * 6:.2f}Gi; the 80% target = {0.80 * 6:.1f}Gi")rows from kubectl get hpa -w (2 replicas running) idle cpu 3% -> 1 memory 52% -> 2 replicas 2 10 users cpu 40% -> 2 memory 53% -> 2 replicas 2 10 users, peak cpu 52% -> 2 memory 54% -> 2 replicas 2 after the stop cpu 10% -> 1 memory 54% -> 2 replicas 2 cpu reading that moves 2 replicas (target 70%) cpu 63% ratio 0.900 formula 2 replicas 2 cpu 76% ratio 1.086 formula 2 replicas 2 cpu 77% ratio 1.100 formula 3 replicas 3 cpu 105% ratio 1.500 formula 3 replicas 3 cpu 106% ratio 1.514 formula 4 replicas 4 cpu 140% ratio 2.000 formula 4 replicas 4 cpu 141% ratio 2.014 formula 5 replicas 5 cpu 176% ratio 2.514 formula 6 replicas 6 cpu 300% ratio 4.286 formula 9 replicas 6 what the percentages are a share of cpu 89% of the 500m request = 445m (the limit is 2000m) memory 56% of the 6Gi request = 3.36Gi; the 80% target = 4.8Gi
What the rule gives on the video's rows
- At idle the formula says 1 (3% of 70%), and
minReplicasholds the count at 2. - The 10-user test never leaves 2. Its highest CPU reading, 52%, gives ceil(2 × 52 / 70) = 2.
- Memory never asks for more than 2. It reads 52% to 56% of the request against a target of 80% in every row, idle or loaded. This Python process loads what it needs at start and keeps it, so memory tells the autoscaler nothing about load here.
- The step from 2 to 3 needs CPU from 77% to 105%. 76% is still inside the tolerance band. 106% would ask for 4, and 176% or more for the maximum of 6. A reading of 300% asks for 9 and is clamped to 6.
- The percentages are shares of the request. 89% CPU is 445m of the 500m request, far below the 2000m limit. 56% memory is 3.36Gi of the 6Gi request, and the 80% target is 4.8Gi.
The rows as a picture
Every CPU reading of the watch output in the video, in order, with the target, the tolerance band and the REPLICAS column.
import matplotlib.pyplot as plt

# cpu % in each row of kubectl get hpa -w in the video; memory stayed between 52 and 56%
idle, ten, stop = [3, 2, 3, 2], [40, 39, 47, 44, 40, 38, 52, 38], [10]
twenty = [63, 82, 89, 59, 56, 75, 60, 88, 87, 82]
cpu = idle + ten + stop + twenty
replicas = [2] * 13 + [3] * 10                     # the REPLICAS column of the same rows

fig, ax = plt.subplots(figsize=(7.6, 4.0))
ax.axhspan(63, 77, color="#fdf0dc", label="tolerance band, 63 to 77%")
ax.axhline(70, color="#e08a1e", linestyle="--", label="cpu target, 70%")
ax.plot(range(len(cpu)), cpu, marker="o", color="#3a6fd8", label="cpu, % of the request")
for start, end, name in [(0, 4, "idle"), (4, 12, "10 users"), (12, 13, "stop"), (13, 23, "20 users")]:
    ax.axvline(start - 0.5, color="#cccccc", linewidth=0.8)
    ax.text((start + end - 1) / 2, 98, name, ha="center", fontsize=9)
ax.set_ylim(0, 106)
ax.set_xlabel("row of the watch output")
ax.set_ylabel("cpu utilisation (%)")
right = ax.twinx()
right.step(range(len(cpu)), replicas, where="mid", color="#d64541", label="REPLICAS column")
right.set_ylim(0, 7)
right.set_ylabel("replicas")
handles = ax.get_legend_handles_labels()[0] + right.get_legend_handles_labels()[0]
ax.legend(handles, [h.get_label() for h in handles], loc="lower right", fontsize=8)
ax.set_title("CPU against its 70% target, and the replica count")
plt.show()

print("highest reading at 10 users:", max(ten), "| lowest and highest at 20 users:", min(twenty), max(twenty))
print("20-user rows above the band:", [c for c in twenty if c > 77], "| inside it:", [c for c in twenty if 63 <= c <= 77])highest reading at 10 users: 52 | lowest and highest at 20 users: 56 89 20-user rows above the band: [82, 89, 88, 87, 82] | inside it: [63, 75]
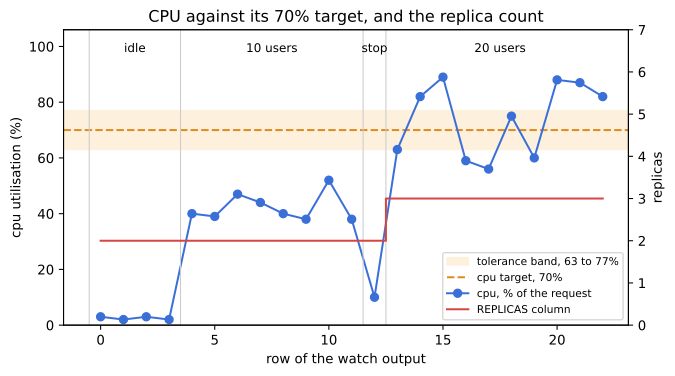
During the 20-user test five of the ten readings are above the band (82, 89, 88, 87 and 82) and the count still stays at 3. The next two sections explain why.
This part of the video starts at 7:30:55. The new pod on screen is in Pending state, and it is still Pending in the last pod list of the video ten minutes later.
Desired is not running
The autoscaler only edits a number: the wanted pod count of the Deployment. Turning that number into a running pod is the scheduler's job, and the scheduler needs a node with enough unreserved memory and CPU for the pod's requests. This is the pod list after the 50-user test.
kubectl get pods -n productionNAME READY STATUS RESTARTS AGE airflow-6c6d6465cc-5zb7h 1/1 Running 1 (5h41m ago) 5h48m opensearch-0 1/1 Running 0 5h57m opensearch-dashboards-6484cf4948-j6q2l 1/1 Running 0 5h55m rag-api-7948f7fb7-dc5k8 0/1 Pending 0 10m rag-api-7948f7fb7-gptk6 0/1 Pending 0 4m4s rag-api-7948f7fb7-hq8lq 1/1 Running 0 4h13m rag-api-7948f7fb7-k7jkq 1/1 Running 0 4h12m rag-api-7948f7fb7-lgjxw 0/1 Pending 0 5m19s rag-api-7948f7fb7-r9h9l 0/1 Pending 0 5m4s
Six rag-api pods exist, the maximum. Two are Running, the same two as before the tests, and four are Pending. The Grafana overview in the video shows the same count: Pending pods 4, OOMKilled containers 0.
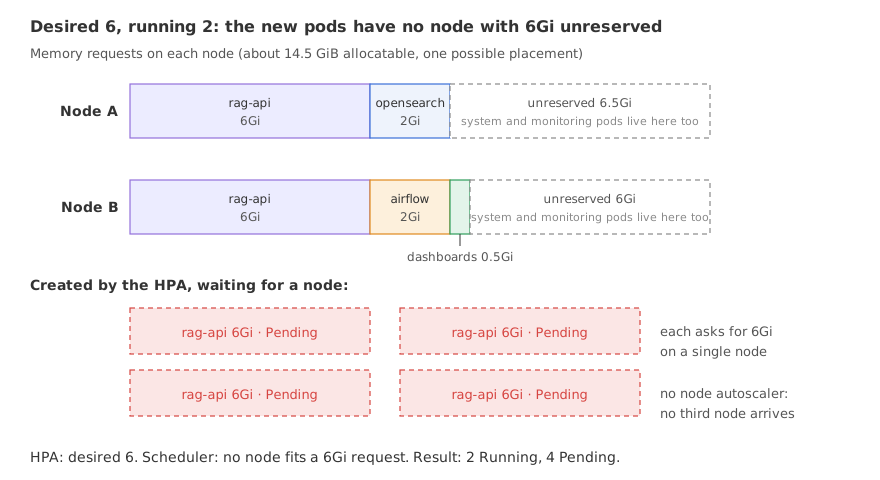
The example works out the room on the two nodes, first with the 6Gi request of the manifest and then with a 3Gi request, which is close to what a pod used.
# kubectl top nodes in the video: MiB in use and the rounded share of allocatable memory
top = [(6184, 42), (6578, 44)]
low = max(used / ((pct + 0.5) / 100) for used, pct in top) / 1024
high = min(used / ((pct - 0.5) / 100) for used, pct in top) / 1024
node = round((low + high) / 2, 1)
print(f"allocatable per node: {low:.2f} to {high:.2f} GiB, taken as {node} GiB; two nodes: {2 * node:.1f} GiB")

others = {"opensearch": 2.0, "airflow": 2.0, "opensearch-dashboards": 0.5}   # memory requests, GiB
for request in (6.0, 3.0):
    print(f"API pod memory request {request:.0f} GiB")
    for pods in (2, 3, 6):
        asked = pods * request + sum(others.values())
        print(f"  {pods} API pods: {asked:.1f} GiB requested, {2 * node - asked:+.1f} GiB against two nodes")
    free_a = node - request - others["opensearch"]
    free_b = node - request - others["airflow"] - others["opensearch-dashboards"]
    print(f"  one API pod per node: node A has {free_a:.1f} GiB unreserved, node B {free_b:.1f} GiB")
print(f" after one more API pod on each node: {free_a - request:.1f} and {free_b - request:.1f} GiB to spare")allocatable per node: 14.44 to 14.55 GiB, taken as 14.5 GiB; two nodes: 29.0 GiB API pod memory request 6 GiB 2 API pods: 16.5 GiB requested, +12.5 GiB against two nodes 3 API pods: 22.5 GiB requested, +6.5 GiB against two nodes 6 API pods: 40.5 GiB requested, -11.5 GiB against two nodes one API pod per node: node A has 6.5 GiB unreserved, node B 6.0 GiB after one more API pod on each node: 0.5 and 0.0 GiB to spare API pod memory request 3 GiB 2 API pods: 10.5 GiB requested, +18.5 GiB against two nodes 3 API pods: 13.5 GiB requested, +15.5 GiB against two nodes 6 API pods: 22.5 GiB requested, +6.5 GiB against two nodes one API pod per node: node A has 9.5 GiB unreserved, node B 9.0 GiB after one more API pod on each node: 6.5 and 6.0 GiB to spare
- The cluster has room in total, not in one piece. With three API pods the requests add up to 22.5 GiB, 6.5 GiB less than the two nodes offer. But a pod must fit on a single node.
- Each node is one request short of comfortable. With one API pod per node, about 6.5 and 6.0 GiB are unreserved. A new pod asks for 6.0, which would leave 0.5 and 0.0 GiB. The cluster's own system pods and the monitoring agents also reserve memory on those nodes, so the new pod fits on neither and waits.
- Six pods cannot fit on two nodes at all: 40.5 GiB requested against 29.0. The Grafana panel in the video shows that same 40.5 GiB as the peak of the memory requests line, while memory in use stayed under 10 GiB.
- Nothing adds a node. The node group allows up to 4 nodes, but no Cluster Autoscaler or Karpenter is installed, so the node count stays at 2.
- A 3Gi request changes the picture. Six API pods would ask for 22.5 GiB in total, and each node could take another pod and still have 6.5 and 6.0 GiB to spare.
Why the count stayed at 3 while CPU read 89%
On two running pods any CPU reading from 77% to 105% gives 3, the step the video shows. Once the third pod exists but is not ready, the controller is careful: before it scales up again it counts every pod that is not ready as using 0% and recomputes. The same example also prints how this manifest scales down once the load is gone.
import math


def scale_up_with_pending(ready_cpu, pending, target=70, tolerance=0.10):
    """Pods that are not ready count as 0% before the controller agrees to scale up."""
    current = len(ready_cpu) + pending
    values = list(ready_cpu) + [0] * pending
    ratio = sum(values) / len(values) / target
    if ratio <= 1 + tolerance:
        return current, ratio
    return math.ceil(ratio * len(values)), ratio


print("3 replicas: 2 Ready, 1 Pending")
for cpu in (82, 89, 116, 150, 200):
    replicas, ratio = scale_up_with_pending([cpu, cpu], pending=1)
    print(f"  ready pods at {cpu:>3}%  ratio with the Pending pod {ratio:.3f}  replicas {min(6, replicas)}")
limit = 1.1 * 70 * 3 / 2
print(f"  the count grows past 3 once the ready pods pass {limit:.1f}%, {limit / 100 * 500:.0f}m of cpu each")

print("scale-down after the load stops (window 300 s, then 1 pod per 60 s)")
t, replicas = 300, 6
while replicas > 2:
    replicas -= 1
    print(f"  t = {t} s -> {replicas} replicas")
t += 603 replicas: 2 Ready, 1 Pending ready pods at 82% ratio with the Pending pod 0.781 replicas 3 ready pods at 89% ratio with the Pending pod 0.848 replicas 3 ready pods at 116% ratio with the Pending pod 1.105 replicas 4 ready pods at 150% ratio with the Pending pod 1.429 replicas 5 ready pods at 200% ratio with the Pending pod 1.905 replicas 6 the count grows past 3 once the ready pods pass 115.5%, 578m of cpu each scale-down after the load stops (window 300 s, then 1 pod per 60 s) t = 300 s -> 5 replicas t = 360 s -> 4 replicas t = 420 s -> 3 replicas t = 480 s -> 2 replicas
- With one Pending pod, 89% becomes a ratio of 0.848. Two pods at 89% and one counted at 0% average 59%, below the target, so the count stays at 3. The percentage in
TARGETSis the average over the two pods that report metrics. - The count moves again only above 115.5% on the ready pods, which is 578m of CPU each. The 50-user test took it there: the pod list shows three more pods created, up to the maximum of 6.
- The pod ages match the scale-up policy. In the video two of those pods appear 15 seconds apart and the third 60 seconds later, which is "at most 2 pods per 60 seconds".
- Scale-down is slow by design. After the load stops nothing happens for 300 seconds, then one pod goes per minute: 5 pods at 300 s, 4 at 360 s, 3 at 420 s and 2 at 480 s, eight minutes in all. The video ends before the first pod is removed.
HPA vs VPA vs Cluster Autoscaler
Three different autoscalers exist, and each changes a different thing.
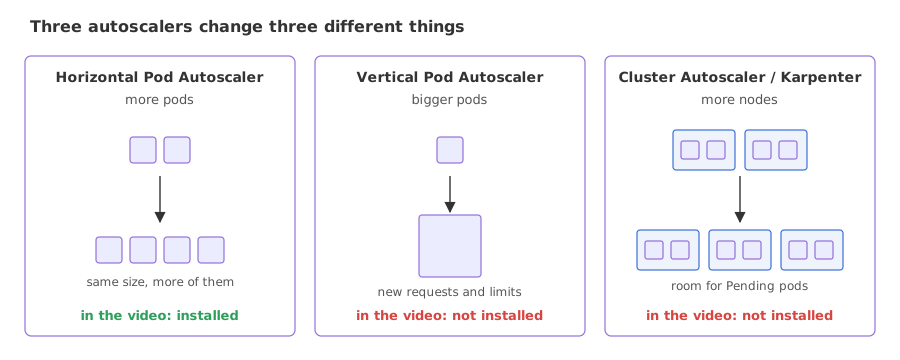
| Horizontal Pod Autoscaler | Vertical Pod Autoscaler | Cluster Autoscaler or Karpenter | |
|---|---|---|---|
| Changes | The number of pods | The requests and limits of each pod | The number of nodes |
| Reacts to | A metric above or below its target | Measured usage over time | Pods that are Pending for lack of room |
| Called | Horizontal scaling, scaling out | Vertical scaling, scaling up | Node scaling |
| In the video's cluster | Installed, 2 to 6 pods | Not installed | Not installed |
Vertical scaling means giving one pod more CPU or memory: editing its requests and limits by hand, letting a Vertical Pod Autoscaler do it, or moving to larger nodes. A request of 6Gi with a limit of 8Gi is not vertical scaling. It fixes what one pod reserves and how far it may burst, and neither value changes while the pod runs. The cluster in the video therefore scales in one direction only, horizontally, and that direction was blocked by the size of the request.
Where you use horizontal pod autoscaling
- Stateless services with uneven traffic, such as an API that is busy by day and idle at night.
- Together with a node autoscaler. The HPA asks for pods and the node autoscaler supplies machines for them. One without the other ends in Pending pods or idle nodes.
- On a signal that follows the load. For an API that mostly waits on a model, requests in flight or queue length tracks load better than CPU, and far better than memory. Kubernetes can scale on such custom metrics.
REPLICAS 6 in kubectl get hpa is a wish, not a fact. Always read kubectl get pods next to it. In the video the Deployment held six pods on paper while 2 served every request, and the failure share of the 50-user test reached 30%.Related
- Previous: Load testing with Locust
- Next: AI security checklist for production
- See also: Deploying on Amazon EKS for requests and limits
- Reference: Horizontal Pod Autoscaling in the Kubernetes docs
- In the rule example, call
hpa(2, 150, 54)and print the result: CPU asks for 5 pods, memory for 2, and the answer is 5. - In the capacity example, change
(6.0, 3.0)to(6.0, 4.0): with a 4 GiB request six API pods ask for 28.5 GiB, 0.5 GiB less than the two nodes offer. - In the last example, change
pending=1topending=0and the list to[cpu, cpu, cpu]: with three ready pods at 89% the ratio is 1.271 and the count goes to 4.
Every expert started right here.