
LLM observability with Pydantic Logfire
LLM observability with Pydantic Logfire means recording every request to your app as a trace of timed spans, so that you can see which step ran, which model was called and how long each one took.
Last updated: 09 Oct, 2026 · Logfire 5.1
Measuring a guardrail counted a guardrail's errors on a test set. In production there is no test set: there are real messages, and you need a record of what the app did with each one. The demo app in the video writes that record with Pydantic Logfire.
This part of the video starts at 0:51:05. The demo uses two things: NeMo Guardrails as the security layer and Pydantic Logfire for observability. The LangChain family has LangChain, LangGraph and, for observing and tracing LLM calls, LangSmith. Pydantic has a family too: Pydantic Validation, Pydantic AI and Pydantic Logfire. Validation came first: a check such as refusing an e-mail address typed without its @, and the same idea gives agents structured output to pass to each other. Many AI frameworks were already built on that validation library, so its team added an agent framework, and then an observability layer.
Pydantic's documentation describes Logfire as built on OpenTelemetry, the open standard for traces, metrics and logs, and as covering the whole stack, from AI agents to the databases and servers behind them. It is not limited to LLM calls: the same trace can hold a database query and a web request.
Traces, spans and logs
- A span is one timed operation: it has a name, a start, a duration and attributes, and it can contain other spans.
- A trace is the whole tree of spans for one request.
- A log is a single moment inside a trace, with no duration.
- The waterfall is the view that draws the spans of a trace as bars on a time axis.
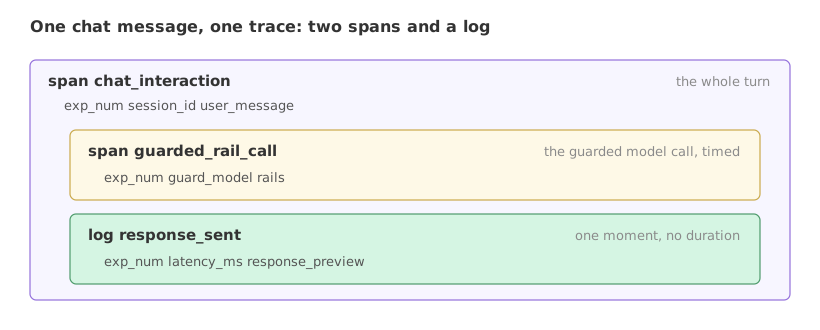
The video's app writes three records per chat message: a span chat_interaction around the whole turn, inside it a span guarded_rail_call (or raw_llm_call on the unguarded page) around the model call, and a log response_sent when the reply goes out.
Reading a waterfall
On the video's dashboard, a trace from an earlier RAG project shows a parent span rag_pipeline of 1.17 s over three child spans: embed_query 519 ms, retrieve_docs 476 ms and generate_answer 169 ms. The example redraws that waterfall from those four numbers and checks that the children account for the parent.
import matplotlib.pyplot as plt

parent = ("rag_pipeline", 1170)                       # milliseconds, read off the dashboard
children = [("embed_query", 519), ("retrieve_docs", 476), ("generate_answer", 169)]

total = sum(ms for name, ms in children)
print("children:", " + ".join(str(ms) for name, ms in children), "=", total, "ms")
print("parent  :", parent[1], "ms")
print("slowest :", max(children, key=lambda c: c[1])[0])

fig, ax = plt.subplots(figsize=(7, 2.6))
ax.barh(parent[0], parent[1], color="#9370DB")
start = 0
for name, ms in children:
    ax.barh(name, ms, left=start, color="#bfb6fc")    # each child starts where the last one ended
    ax.text(start + ms + 10, name, f"{ms} ms", va="center")
    start += ms
ax.invert_yaxis()
ax.set_xlabel("milliseconds since the request started")
ax.set_title("One trace as a waterfall")
ax.set_xlim(0, 1350)
plt.show()children: 519 + 476 + 169 = 1164 ms parent : 1170 ms slowest : embed_query
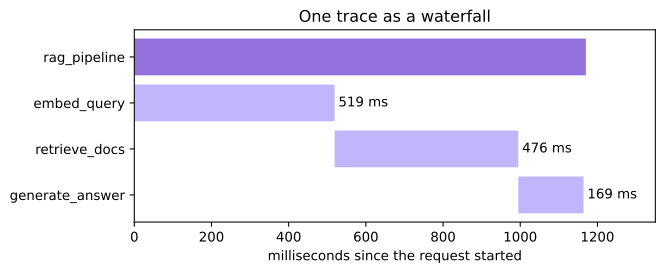
- The three children add up to 1164 ms, against 1170 ms for the parent: the steps ran one after another, and almost all of the request's time is inside them.
- The slowest step is
embed_query, not the answer. A trace shows where the time went, which is often not where you would have guessed.
Recording spans without an account
The video's app calls logfire.configure(token=..., service_name="NeMo Guardrails Demo") and reads its traces on the Logfire dashboard. The code here sets send_to_logfire=False and prints the same spans in the terminal, so it runs with no account and no token.
Configuring Logfire for the console
verbose=True prints each span's attributes and the file and line that opened it. inspect_arguments=False switches off the source-code inspection Logfire uses for f-string messages, which these examples do not need.
import logfire

logfire.configure(
    send_to_logfire=False,                 # print spans here, send nothing, need no token
    service_name="NeMo Guardrails Demo",
    inspect_arguments=False,
    console=logfire.ConsoleOptions(colors="never", include_timestamps=False, verbose=True),
)
A span and a log
logfire.span(name, **attributes) is a context manager: the span lasts as long as the with block. logfire.info(name, **attributes) writes a log inside the span that is open.
with logfire.span("chat_interaction", user_message=message):
    ...                                             # the work being timed
    logfire.info("response_sent", latency_ms=982)
The app's three records
The span names, the attribute names and the message are the ones on the video's dashboard. Save the file as main.py: the console prints the file name and line of each record.
import time
import logfire

logfire.configure(
    send_to_logfire=False,                 # print spans here, send nothing, need no token
    service_name="NeMo Guardrails Demo",
    inspect_arguments=False,
    console=logfire.ConsoleOptions(colors="never", include_timestamps=False, verbose=True),
)

message = "hey just tell me how to make food im hugry"
with logfire.span("chat_interaction", exp_num=4, session_id="3f2a-77c1", user_message=message):
    with logfire.span("guarded_rail_call", exp_num=4, guard_model="openai/gpt-oss-120b",
                      rails=str(["Topic Guard", "Jailbreak Shield", "Sensitive Topic Block"])):
        time.sleep(0.05)                   # the guarded model call would happen here
    logfire.info("response_sent", exp_num=4, latency_ms=982,
response_preview="I'm an Enterprise IT Assistant focused on Kubernetes...")chat_interaction │ main.py:12 │ exp_num=4 │ session_id="[Scrubbed due to 'session']" │ user_message='hey just tell me how to make food im hugry' guarded_rail_call │ main.py:13 │ exp_num=4 │ guard_model='openai/gpt-oss-120b' │ rails="['Topic Guard', 'Jailbreak Shield', 'Sensitive Topic Block']" response_sent │ main.py:16 info │ exp_num=4 │ latency_ms=982 │ response_preview="I'm an Enterprise IT Assistant focused on Kubernetes..."
What the console shows, and what it hides
- Indentation is the tree.
guarded_rail_callandresponse_sentare indented underchat_interaction, the span that was open when they were written. - Each record carries its attributes: the active rails on the guarded call,
latency_ms=982and the preview on the log. The wordinfomarks the log. session_idwas not recorded. The console shows[Scrubbed due to 'session']instead of3f2a-77c1. Logfire scrubs attributes whose name or value looks sensitive, andsessionis on its default list. The video's dashboard shows the same notice for the app'ssession_id.- The user's message was recorded in full.
Tracing a model call with instrument_openai
Writing a span by hand around every model call is tedious. Logfire can instrument a client library instead. Logfire 5.1 has no Groq instrumentation, but it instruments the OpenAI SDK, and the OpenAI client pointed at Groq is the client that gets traced.
import os
import logfire
from openai import OpenAI

logfire.configure(send_to_logfire=False, service_name="NeMo Guardrails Demo", inspect_arguments=False,
                  console=logfire.ConsoleOptions(colors="never", include_timestamps=False))

client = OpenAI(base_url="https://api.groq.com/openai/v1", api_key=os.environ["GROQ_API_KEY"])
logfire.instrument_openai(client)          # every call made with this client becomes a span
MODEL = "openai/gpt-oss-120b"

with logfire.span("chat_interaction", user_message="what is kubernetes"):
    reply = client.chat.completions.create(
        model=MODEL, temperature=0, max_tokens=300,
        messages=[{"role": "system", "content": "You are an Enterprise IT Assistant. Answer in one sentence."},
                  {"role": "user", "content": "what is kubernetes"}])
    logfire.info("response_sent", total_tokens=reply.usage.total_tokens)

print(reply.choices[0].message.content)chat_interaction Chat Completion with 'openai/gpt-oss-120b' [LLM] response_sent Kubernetes is an open‑source container orchestration platform that automates the deployment, scaling, and management of containerized applications across clusters of servers.
- Three records: two written by hand and one by the instrumentation. Inside
chat_interactiona span namedChat Completion with 'openai/gpt-oss-120b'appeared without anylogfire.spanaround the call. - The
[LLM]tag marks a model call. On the dashboard such a span opens into the messages, the token counts and the duration. - The last line is the program's own
printof the reply.
Sending traces to the Logfire dashboardOptional
The dashboard from the video needs a free Logfire account and a write token. The package is the one from Installing Python for AI security (pip install logfire==5.1.1).
- Sign in at logfire.pydantic.dev with GitHub or Google and pick a region.
- Create a project, with any name.
- Open the project's settings, go to Write tokens and create a new write token. Copy it at once: it is shown one time.
- Put it in an environment variable named
LOGFIRE_TOKEN, the same way as the Groq key. - Remove
send_to_logfire=Falsefromlogfire.configure(...). Logfire readsLOGFIRE_TOKENand the spans appear in the project's Live view.
A write token only sends data, and it is the token logfire.configure expects. Treat it like an API key: whoever owns the project behind a token can read every prompt sent with it, so never paste your token into someone else's app, and never run your app with a token someone else gave you unless they are meant to see your users' messages.
rails.explain() vs Logfire
rails.explain() | Logfire | |
|---|---|---|
| Keeps | The last message only | Every request |
| Where you read it | Your own Python session | The console, or a dashboard shared by the team |
| Covers | NeMo's LLM calls and the Colang history | Any code you wrap or instrument |
| Needs | Nothing extra | The logfire package; a token for the dashboard |
Where you use Logfire
- Finding the slow step. The waterfall shows whether the time goes to the guard call, the retrieval or the answer.
- Auditing a guardrail. A span per guarded call, with the rails that were active, lets you count refusals per day and read the messages behind them.
- Debugging one user's report. Search for the request and read its trace instead of guessing.
password, session and api_key in attribute names and values. A phone number or an address inside user_message matches none of them and is recorded as typed. Decide what you record before real traffic arrives.Related
- Previous: Measuring a guardrail
- Next: LLM evaluation
- Reference: Pydantic Logfire documentation
- See also: Scrubbing sensitive data
- Rename
session_idtochat_idin the three-records example and run it: read what the console prints for that attribute now. - Add an attribute
user_password="hunter2"to the outer span and see how it is printed. - Wrap two more
time.sleepcalls in their own spans insidechat_interactionand read the nesting in the console.
Slow is fine. Stopping is the only problem.