
Tracing agents with Langfuse
Langfuse is an open-source LLM observability platform that records each request to an agent as a trace: a tree of timed steps with their inputs, outputs and token counts.
Last updated: 09 Oct, 2026 · Langfuse SDK 4.15
The agent in Agentic RAG API with FastAPI and LangGraph runs up to ten steps for one question, and its container log only says that an answer came back after 25 seconds. A trace says where the 25 seconds went. The project sends ordinary application logs to Logfire, the tool of LLM observability with Pydantic Logfire, and sends the agent's steps to Langfuse.
Traces, observations and scores
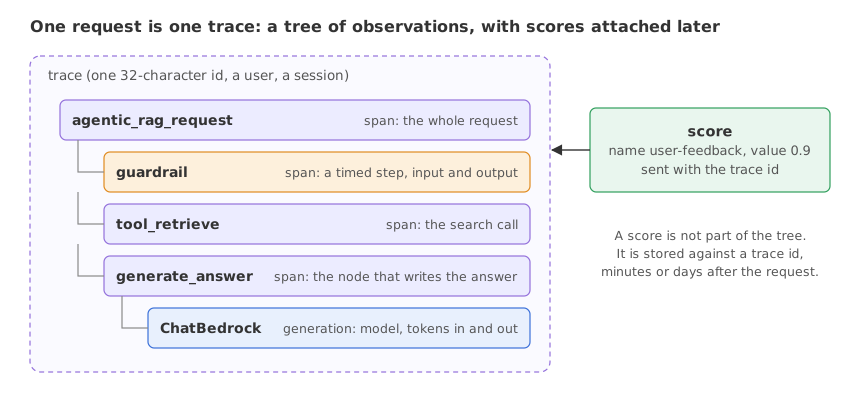
- A trace is everything recorded for one request. It has one id, and it can carry a user id and a session id so that requests of one conversation can be listed together.
- An observation is one step inside a trace. It has a name, a start and an end time, an input and an output. Observations nest, which gives the tree.
- A span is the plain kind of observation: a timed step such as a guardrail check or a search.
- A generation is an observation for a model call. On top of what a span holds, it records the model name and the token usage.
- A score is a number or a label attached to a trace after the fact: a thumbs-up from a user, a faithfulness value from an evaluation run.
Reading the trace of one answered request
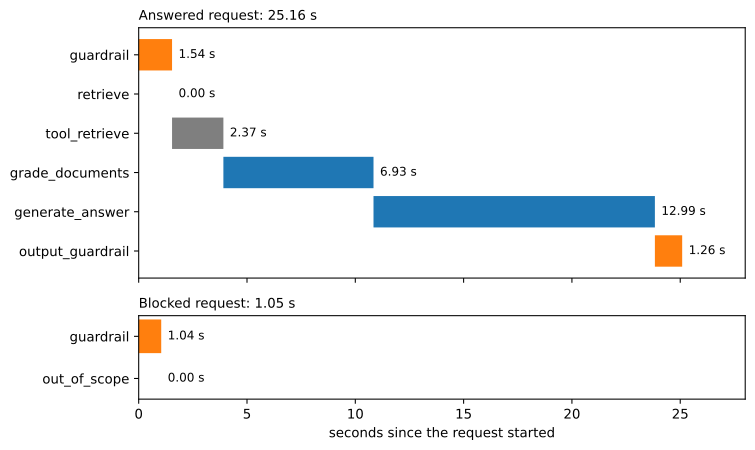
The video asks the agent "what is Vector Policy?" and opens the trace. These are the observations on screen, with the latency Langfuse shows next to each. A second trace, for a question the guardrail blocked, is listed under it.
| Observation | Kind | Latency | Tokens in → out |
|---|---|---|---|
| agentic_rag_request | span, the whole request | 25.16 s | |
| guardrail | span | 1.54 s | |
| retrieve | span | 0.00 s | |
| tool_retrieve | span | 2.37 s | |
| grade_documents | span, with one model call inside | 6.93 s | 2,776 → 159 |
| generate_answer | span, with one model call inside | 12.99 s | 2,827 → 335 |
| output_guardrail | span | 1.26 s | |
| agentic_rag_request (blocked question) | span, the whole request | 1.05 s | |
| guardrail (blocked question) | span | 1.04 s |
The code below draws both traces as a waterfall, the picture a tracing tool shows: one bar per step, each starting where the step before it ended. The numbers are typed from the table above.
import matplotlib.pyplot as plt

# seconds per node, read from the two traces on screen in the video
answered = [("guardrail", 1.54, "guard"), ("retrieve", 0.00, "other"), ("tool_retrieve", 2.37, "other"),
            ("grade_documents", 6.93, "llm"), ("generate_answer", 12.99, "llm"),
            ("output_guardrail", 1.26, "guard")]
blocked = [("guardrail", 1.04, "guard"), ("out_of_scope", 0.00, "other")]
colors = {"guard": "tab:orange", "llm": "tab:blue", "other": "tab:gray"}

fig, axes = plt.subplots(2, 1, figsize=(8, 4.8), sharex=True, gridspec_kw={"height_ratios": [6, 2]})
for ax, nodes, title in [(axes[0], answered, "Answered request: 25.16 s"),
                         (axes[1], blocked, "Blocked request: 1.05 s")]:
    start = 0.0
    for row, (name, seconds, kind) in enumerate(nodes):
        ax.barh(row, seconds, left=start, color=colors[kind])
        ax.text(start + seconds + 0.3, row, f"{seconds:.2f} s", va="center", fontsize=9)
        start += seconds                     # each node starts where the one before it ended
    ax.set_yticks(range(len(nodes)), [n for n, _, _ in nodes])
    ax.invert_yaxis()
    ax.set_title(title, loc="left", fontsize=10)
    ax.set_xlim(0, 28)
axes[1].set_xlabel("seconds since the request started")
plt.tight_layout()
plt.show()

total = sum(sec for _, sec, _ in answered)
llm = sum(sec for _, sec, kind in answered if kind == "llm")
guard = sum(sec for _, sec, kind in answered if kind == "guard")
print(f"nodes add up to {total:.2f} s of the 25.16 s request")
print(f"two LLM nodes:       {llm:.2f} s = {llm / 25.16:.1%}")
print(f"two guardrail nodes: {guard:.2f} s = {guard / 25.16:.1%}")
print(f"tokens: {2776 + 159} + {2827 + 335} = {2776 + 159 + 2827 + 335}")
print(f"a blocked request took 1.05 s, {1.05 / 25.16:.1%} of the answered one")nodes add up to 25.09 s of the 25.16 s request two LLM nodes: 19.92 s = 79.2% two guardrail nodes: 2.80 s = 11.1% tokens: 2935 + 3162 = 6097 a blocked request took 1.05 s, 4.2% of the answered one
What the waterfall shows
- The six nodes add up to 25.09 s of the 25.16 s request. The remaining 0.07 s is spent between nodes.
- The two nodes that call the model take 19.92 s, 79.2% of the request. Answer generation alone is the longest bar. Any plan to make this agent faster starts with the model calls: a faster model, shorter prompts, or one call fewer.
- The two guardrail nodes take 2.80 s, 11.1%. That is the price, in latency, of checking the question and the answer.
- The two model calls used 2,935 and 3,162 tokens, 6,097 for one answer. Most of them are input: the retrieved chunks are sent to the model twice, once to be graded and once to be answered from.
- The blocked request ended after 1.05 s, 4.2% of the answered one. One guardrail call, then the refusal. Refusing early is cheap.
Setting up Langfuse keysOptional
The examples in this lesson need no account. To see your own traces in the Langfuse web page, install the SDK and add two keys.
pip install langfuse==4.15.6- Create an account at cloud.langfuse.com, or run the open-source server yourself. Create an organization and a project.
- In the project's settings, open the API keys page and create a key pair. The public key starts with
pk-lf-and the secret key withsk-lf-. The secret key is shown once. - Set three environment variables:
LANGFUSE_PUBLIC_KEY,LANGFUSE_SECRET_KEYandLANGFUSE_HOST. The host ishttps://cloud.langfuse.comfor the EU region andhttps://us.cloud.langfuse.comfor the US region, the one the project uses. - Never paste the secret key into code, a notebook cell or a chat; Installing Python for AI security covers key hygiene.
from langfuse import get_client

langfuse = get_client()        # reads LANGFUSE_PUBLIC_KEY, LANGFUSE_SECRET_KEY and LANGFUSE_HOST
print(langfuse.auth_check())   # True when the keys are accepted
Not run here: it needs your own Langfuse keys.
Creating observations with the v4 SDK
The Langfuse Python SDK is built on OpenTelemetry, the open standard for traces: every observation is an OpenTelemetry span with Langfuse attributes on it. One method creates all of them, and as_type says which kind.
The root span
with langfuse.start_as_current_observation(name="agentic_rag_request", as_type="span") as root:
    root.update(input={"query": query})
    trace_id = langfuse.get_current_trace_id()   # 32 hex characters, returned to the caller
    ...                                           # every observation created here is a child
    root.update(output={"answer": answer})
start_as_current_observation is a context manager. The observation starts when the block is entered, ends when it is left, and is the parent of anything created inside. The project returns the trace id in its API response, so a client can refer to this trace later.
A generation with token usage
with langfuse.start_as_current_observation(name="generate_answer", as_type="generation",
                                           model="demo-model", input=prompt) as gen:
    answer = call_the_model(prompt)
    gen.update(output=answer, usage_details={"input": 2827, "output": 335, "total": 3162})
A generation takes a model name and usage_details. With both, Langfuse can add up tokens per trace and estimate cost. start_observation, without as_current, returns an object you end yourself with .end(); an observation that is never ended never shows a duration.
User and session
from langfuse import propagate_attributes

with propagate_attributes(user_id="api_user", session_id="session_api_user"):
    ...                        # observations created in this block carry the user and the session
A trace that stays on your machine
The project sends its traces to Langfuse Cloud. The example gives the client dummy keys and an OpenTelemetry in-memory exporter, so the same calls run with no account and every finished observation stays in the process, where it can be printed.
from langfuse import Langfuse, propagate_attributes
from opentelemetry.sdk.trace.export.in_memory_span_exporter import InMemorySpanExporter

exporter = InMemorySpanExporter()            # finished spans stay in this process
langfuse = Langfuse(public_key="pk-lf-demo", secret_key="sk-lf-demo",
                    host="http://localhost:9", span_exporter=exporter)

query = "what is Vector Policy?"
with langfuse.start_as_current_observation(name="agentic_rag_request", as_type="span") as root:
    root.update(input={"query": query}, metadata={"top_k": 3})
    trace_id = langfuse.get_current_trace_id()
    with propagate_attributes(user_id="api_user", session_id="session_api_user"):
        guard = langfuse.start_observation(name="guardrail", as_type="span", input={"query": query})
        guard.update(output={"score": 100, "reason": "Content passed all guardrail checks"})
        guard.end()
        with langfuse.start_as_current_observation(name="generate_answer", as_type="generation",
                                                   model="demo-model", input="prompt text") as gen:
            # token counts copied from the video's trace as sample values; no model is called
            gen.update(output="answer text", usage_details={"input": 2827, "output": 335, "total": 3162})
    root.update(output={"answer": "answer text"})

langfuse.flush()
spans = exporter.get_finished_spans()
print("trace id length:", len(trace_id), "| observations captured:", len(spans))
for s in spans:
    a = s.attributes
    print(f"  {s.name:20} type={a.get('langfuse.observation.type'):11}"
          f" user={a.get('user.id')}  usage={a.get('langfuse.observation.usage_details')}")
ids = {format(s.context.trace_id, "032x") for s in spans}
print("one trace id on every observation:", ids == {trace_id})trace id length: 32 | observations captured: 3
guardrail type=span user=api_user usage=None
generate_answer type=generation user=api_user usage={"input": 2827, "output": 335, "total": 3162}
agentic_rag_request type=span user=api_user usage=None
one trace id on every observation: TrueWhat the three observations hold
- Three observations were captured, all with one 32-character trace id. The id is what the project hands back to the caller.
- The exporter lists them in the order they ended:
guardrailfirst, the root spanagentic_rag_requestlast, because a parent ends after its children. - Only the generation carries usage: 2827 input tokens, 335 output, 3162 in total, the numbers passed in
usage_details. - Every line prints
user=api_user, the root span included, although only the two children were created inside thepropagate_attributesblock.
v3 names vs v4 names
The project's start-up log prints "Langfuse v3 tracing initialized", and its comments say v3. Its pyproject.toml installs langfuse>=4.0.0, and the code calls v4 methods. The v3.177 next to the logo on the Langfuse page is the version of the server, a different number from the SDK version. Tutorials written for older SDKs use names that are gone:
| Older SDK | SDK 4.x |
|---|---|
start_as_current_span(...), start_as_current_generation(...) | start_as_current_observation(as_type="span") or as_type="generation" |
start_span(...), start_generation(...) | start_observation(as_type=...) |
update_current_trace(user_id=..., session_id=...) | propagate_attributes(user_id=..., session_id=...) |
client.score(...) | client.create_score(...) |
from langfuse.decorators import observe | from langfuse import observe, get_client |
from langfuse.callback import CallbackHandler | from langfuse.langchain import CallbackHandler |
CallbackHandler(trace_name=..., user_id=...) | CallbackHandler(); the attributes come from propagate_attributes |
Sending feedback as a score
The project's POST /api/v1/feedback route takes a trace id, a score from -1 to 1 and an optional comment, and stores it on the trace. In the video the body is {"comment": "This answer was very helpful and accurate!", "score": 0.9, "trace_id": "<trace-id>"} and the reply is {"message": "Feedback recorded successfully", "success": true}. Inside, it is one SDK call:
self.client.create_score(
    trace_id=trace_id,
    name=name,            # "user-feedback" by default
    value=score,
    comment=comment,
)
Shown as it ran in the video, not run here: it needs Langfuse keys: a score is sent to the Langfuse server, not kept in the process.
The feedback is kept apart from the request: the answer goes out first, and the score arrives whenever the user or a reviewer sends it. That one human score is the only evaluation recorded in the video. Metrics such as the one in Faithfulness are computed by an evaluation run and attached to traces the same way, as further scores.
Keeping personal data out of traces
A trace stores inputs and outputs as they are. The trace list in the video shows the test questions with a card number and a phone number in full, because the question is recorded before any guardrail runs. The client takes a mask function for this: it is called on every input, output and metadata value before the observation is exported.
import re

from langfuse import Langfuse
from opentelemetry.sdk.trace.export.in_memory_span_exporter import InMemorySpanExporter

CARD = re.compile(r"\b\d(?:[ -]?\d){12,15}\b")
PHONE = re.compile(r"\+\d[\d -]{8,}\d")

def mask(data, **kwargs):                    # called on every input, output and metadata value
    if isinstance(data, str):
        return PHONE.sub("<PHONE>", CARD.sub("<CARD>", data))
    if isinstance(data, dict):
        return {key: mask(value) for key, value in data.items()}
    if isinstance(data, list):
        return [mask(value) for value in data]
    return data

queries = ["My credit card 4111-1111-1111-1111 was charged, find papers about fraud detection ML",
           "Call me at +1-555-867-5309, I need help finding papers on neural networks"]

for label, mask_fn in [("no mask", None), ("with mask", mask)]:
    exporter = InMemorySpanExporter()
    langfuse = Langfuse(public_key=f"pk-lf-{label[:2]}", secret_key="sk-lf-demo",
                        host="http://localhost:9", span_exporter=exporter, mask=mask_fn)
    for q in queries:
        with langfuse.start_as_current_observation(name="agentic_rag_request", as_type="span") as root:
            root.update(input={"query": q})
    langfuse.flush()
    print(label)
    for s in exporter.get_finished_spans():
print(" stored input:", s.attributes["langfuse.observation.input"])no mask
stored input: {"query": "My credit card 4111-1111-1111-1111 was charged, find papers about fraud detection ML"}
stored input: {"query": "Call me at +1-555-867-5309, I need help finding papers on neural networks"}
with mask
stored input: {"query": "My credit card <CARD> was charged, find papers about fraud detection ML"}
stored input: {"query": "Call me at <PHONE>, I need help finding papers on neural networks"}What was stored with and without the mask
- Without a mask the card number and the phone number are stored as typed. This is the state of the trace list in the video.
- With the mask the stored inputs read
<CARD>and<PHONE>, and the rest of each question is unchanged, so the trace is still useful for debugging. - The two patterns catch these two formats. A regular expression misses formats nobody wrote a pattern for, as the examples in Input and output rails showed, so treat the mask as a net with holes and keep sensitive fields out of the input where you can.
- Mask before export. What reaches the tracing server is copied to its database and its backups, and is visible to everyone with access to the project.
- Keep secrets out of URLs. HTTP client logging records the full address of every call, so a token placed in a URL path or query string is written to every log and trace that records the call.
- Sample and expire. The client has a
sample_ratesetting for tracing a share of requests, and old traces should be deleted on a schedule you choose.
Logfire vs Langfuse in this project
| Logfire | Langfuse | |
|---|---|---|
| What the project sends | Application logs: HTTP calls, database and Redis commands, one row per request | The agent's steps: one observation per graph node and per model call |
| Question it answers | Did the request arrive, and which services did it call? | Which node took the time, what did the model read and write, how many tokens? |
| LLM-specific records | Spans from instrumented clients | Generations, token usage, scores, datasets |
| Where to start looking | A failing or missing request | A slow or wrong answer |
Where you use Langfuse tracing
- Latency work. The waterfall shows which node to speed up, cache or run in parallel.
- Debugging a wrong answer. The input and output of every node are there, so you can see whether the search returned the wrong chunk or the model misread the right one.
- Collecting feedback. A score per trace turns scattered opinions into a column you can sort.
create_score stores a score for whatever trace id it is given. It does not check that the id belongs to the answer the user saw, and the API still returns success. Take the trace id from the response of the request being rated, never from an example or a previous call.Related
- Previous: Agentic RAG API with FastAPI and LangGraph
- Next: Amazon Bedrock Guardrails
- See also: LLM observability with Pydantic Logfire
- Reference: Langfuse: SDK overview, Langfuse: Masking, Langfuse: Scores via SDK
- In the trace example, move the
generate_answerblock out of thepropagate_attributesblock (one indent level left) and run it: itsuser=column now printsNone, while the other two lines keepapi_user. - In the mask example, add an e-mail pattern to
maskand a third query that contains an address such asreader@example.com. - In the waterfall code, set the
generate_answertime to 6.5, as if the answer were streamed from a faster model, and read the new share of the two LLM nodes: 53.4%.
Slow is fine. Stopping is the only problem.