
The signals to monitor
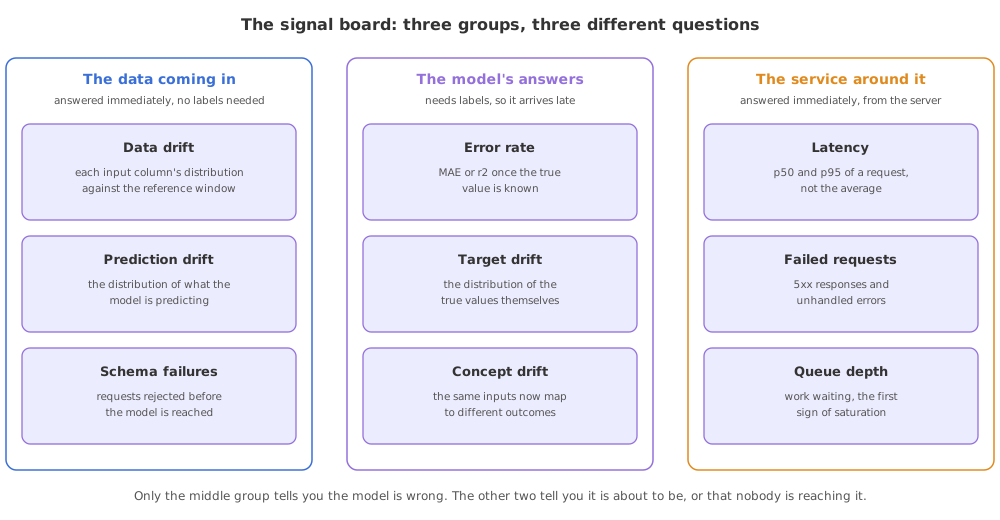
A monitoring signal is one number, read off the running service on a schedule, that tells you something about whether it is still working. A model service needs three kinds: what the data looks like, what the model is getting right, and whether the service is answering at all.
Last updated: 19 Oct, 2026 · MLOps
Data drift with Evidently gave one of those numbers. A drifted column on its own does not tell you to act, and a service can also fail in ways no drift report sees. This lesson is the whole board, and what each number is worth.
Grouping the signals by what they answer
The useful split is not data against model; it is how long you wait for the answer. Two of the three groups can be read the moment traffic arrives. The middle one waits for the truth, and the wait is why drift monitoring exists at all.
The clip reads these signals off Evidently 0.4's regression report, which 0.7 rebuilt and reaches differently; the signals it names, model quality, predicted against actual, the error distribution, error normality and bias, are the ones this lesson lists.
What each signal means
| Signal | What it is | When you can read it |
|---|---|---|
| Data drift | The distribution of an input column against the reference window | Immediately, from the requests |
| Prediction drift | The distribution of the model's own output against the reference | Immediately, from the responses |
| Schema failures | Requests refused because a field is missing or out of range | Immediately, from the API |
| Error rate | MAE, RMSE or r2 of predictions against the true values | Once the true value is recorded |
| Target drift | The distribution of the true values themselves | Once the true value is recorded |
| Concept drift | The same inputs now map to different outcomes | Only by comparing error over time |
| Latency | How long a request takes, read as p50 and p95 | Immediately, from the server |
| Failed requests | 5xx responses and unhandled exceptions | Immediately, from the server |
| Queue depth | How much work is waiting to be served | Immediately, from the server |
Prediction drift deserves its own line, because it is the cheapest early warning there is. You do not need a true value to notice that a model which used to predict a mean of 64 is now predicting a mean of 73. Nothing about the model changed, so the inputs did.
The schema the service checks every request against
A request that fails validation is a signal, not an error to hide. The same Pydantic model the API uses is reusable here: it says which fields must be there and that the two scores must sit between 0 and 100.
from pydantic import BaseModel, Field, ValidationError

class StudentRecord(BaseModel):
    gender: str
    race_ethnicity: str
    parental_level_of_education: str
    lunch: str
    test_preparation_course: str
    reading_score: int = Field(ge=0, le=100)   # a mark outside this range is not a mark
writing_score: int = Field(ge=0, le=100)def accepted(record):
"""True when the record passes the schema the API checks every request against."""
try:
StudentRecord(**record)
return True
except ValidationError:
return FalseThe model and the traffic to watch
The model here is the one from Why a live model decays, fitted on the students who did no preparation course, and the traffic is the group that arrived after it. Three of those records carry a reading score of 150, which is the kind of thing a real feed sends on a bad day.
model = fit_forest(ref)

# the traffic to watch, with three records that will not pass the schema
live = cur.copy()
live.loc[live.index[:3], "reading_score"] = 150
Reading a day of traffic as five numbers
Everything above the last line can be read today. The last line is the one that waits for the marks to come back, and it is printed here only because this dataset happens to carry them.
from sklearn.metrics import mean_absolute_error

# every record is checked before it is scored, the way the API checks it
features = live.drop(columns=["math_score"])
passed = features.apply(lambda row: accepted(row.to_dict()), axis=1)
predictions = model.predict(features[passed])

print("requests             ", len(features))
print("served               ", int(passed.sum()))
print("rejected             ", int((~passed).sum()))
print("mean prediction      ", round(float(predictions.mean()), 2))
print("reference mean       ", round(float(model.predict(ref.drop(columns=["math_score"])).mean()), 2))
print("MAE once marks arrive", round(mean_absolute_error(live.math_score[passed], predictions), 4))requests 358 served 355 rejected 3 mean prediction 72.92 reference mean 64.11 MAE once marks arrive 5.691
What those five numbers say
- Three rejected out of 358 is the schema doing its job. A rejection is cheap and visible; the same three records reaching the model would have produced three confident wrong answers instead.
- The mean prediction moved by about nine marks, from the reference window to this one. No true value was needed to see it, which makes prediction drift the fastest signal on the board.
- The error rate is the slow one. It is the number that proves the model is wrong rather than merely being asked something new, and it exists only because the marks happen to be in this dataset.
- Counts matter as much as rates. Served and rejected together say how much traffic there was; a rate on its own hides a day when nobody called the service.
Reading latency as percentiles, not averages
- An average hides the tail. If 99 requests take 20 ms and one takes 4 seconds, the average looks fine and one user waited 4 seconds. p95 and p99 are what a user feels.
- Model latency is not request latency. Loading the frame, transforming it and running the forest is one part; the network, the gateway and the queue are the rest. Time them separately or the number tells you nothing about where to look.
- Queue depth leads latency. Work piling up is visible before response times rise, which makes it the signal worth alerting on when traffic grows.
Related
- Previous: Data drift with Evidently
- Next: Retraining strategies
- See also: Request and response schemas
- Corrupt ten records instead of three and watch the rejected count rise while the mean prediction barely moves.
- Set one record's lunch to a value the training data never had, and check that it is served rather than rejected: the schema only knows types and ranges, not categories.
- Print the predictions' standard deviation next to their mean, and decide whether a narrowing spread would worry you.
Little by little, you're building something great.