Black box vs white box models
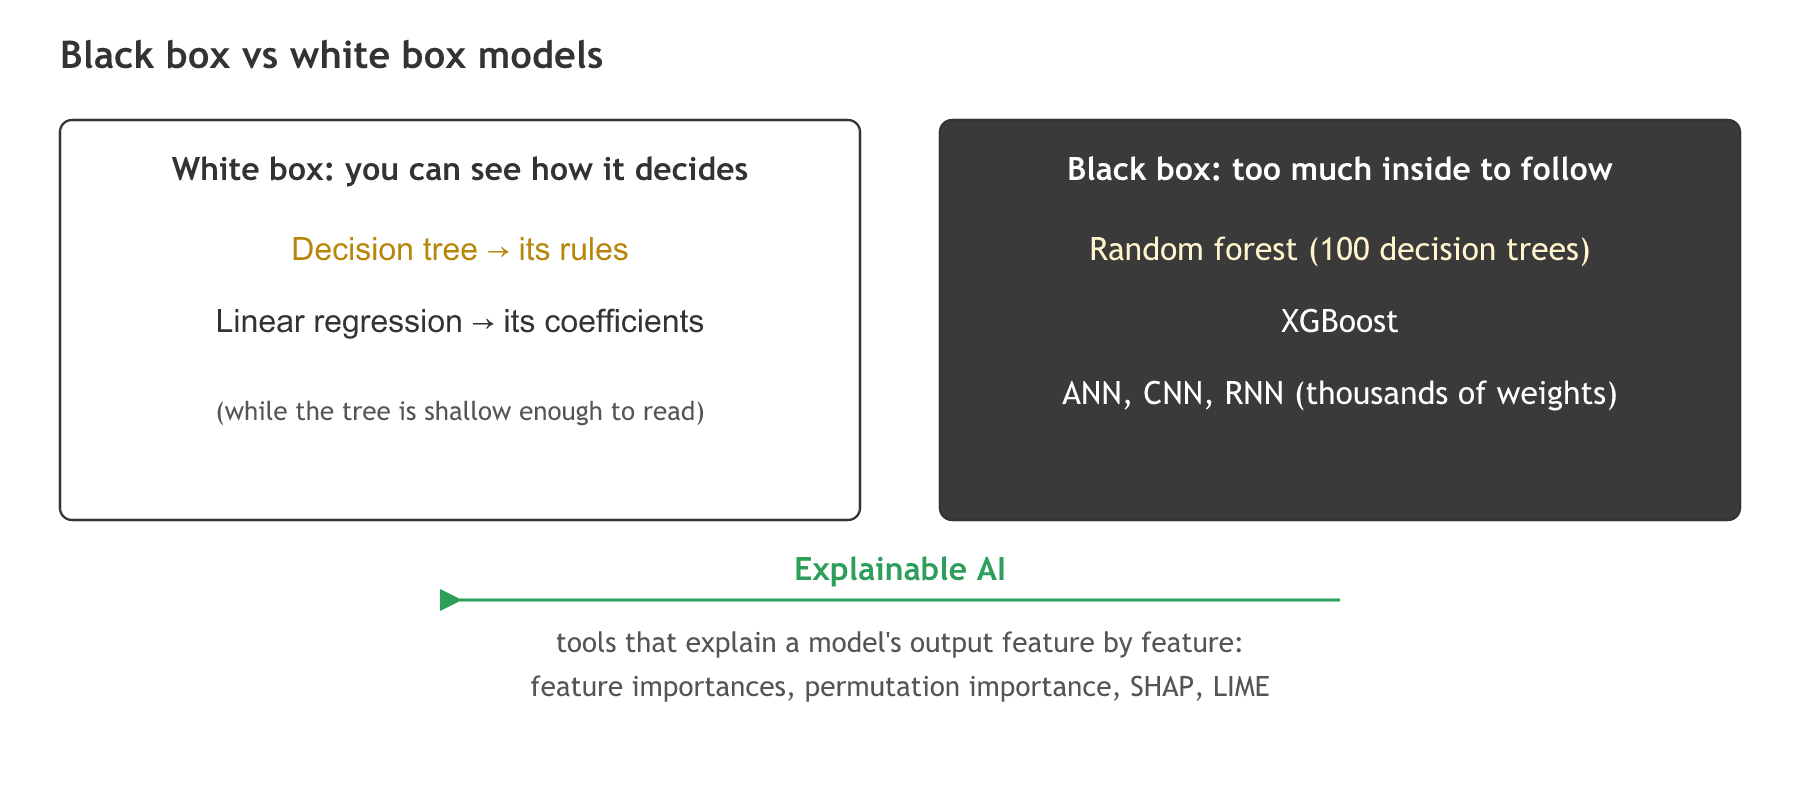
Black box vs white box is a way of sorting models by interpretability: a white box model lets you see how it reaches a prediction, and a black box model is too complex to follow by looking inside it.
Last updated: 05 Oct, 2026 · scikit-learn 1.9.1
The churn network of Training and evaluating an ANN predicts with 85% accuracy, but its 271 weights do not say why a customer is likely to leave. The video closes the ANN practical with this trade-off, a common interview question.
Classifying models as black box or white box
The video asks which kind each model is, and answers:
- Random forest is a black box: with 100 decision trees it is very difficult to follow every tree.
- A decision tree is a white box: you can see the splits it makes and follow any prediction from the root to a leaf.
- An ANN is a black box: you cannot monitor all the weights and see how it works internally.
- XGBoost is a black box, for the same reason as random forest: many trees.
- Linear regression is a white box: each coefficient says how much the prediction moves per unit of a feature.
- CNNs and RNNs are black boxes too: you can see up to some level, such as the filters of the first layers, but not everything.
White box holds only while the model stays small. A decision tree 30 levels deep, or a linear model with thousands of features, is white box in principle but no longer readable by a person.
Explaining black box models with explainable AI
Because the accurate models are often the black box ones, the video points to explainable AI: tools that show how a model performs with respect to each input feature, an area of active research. Common tools today are feature importances for tree ensembles, permutation importance (shuffle one feature and see how much the score drops), SHAP (how much each feature pushed one prediction up or down) and LIME (a small white box model fitted around one prediction).
Inspecting the churn models
Reading a white box tree and its rules
export_text prints a fitted tree's splits as rules. The tree is fitted on the unscaled columns, since trees need no scaling, so its thresholds are in real units.
tree = DecisionTreeClassifier(max_depth=2, random_state=0).fit(X_tr, y_tr)
print(export_text(tree, feature_names=names, decimals=1))
Explaining the forest with permutation importance
A forest of 100 trees cannot be read rule by rule, but permutation_importance shuffles one column of the test set at a time and measures how much the accuracy falls.
imp = permutation_importance(forest, X_test, y_test, n_repeats=5, random_state=0)
imp.importances_mean # accuracy lost when each feature is shuffledimport numpy as np
from sklearn.tree import DecisionTreeClassifier, export_text
from sklearn.linear_model import LogisticRegression
from sklearn.ensemble import RandomForestClassifier
from sklearn.inspection import permutation_importance
names = list(X.columns)
X_tr, X_te, y_tr, y_te = train_test_split(X, y, test_size=0.2, random_state=0) # unscaled, for the tree
tree = DecisionTreeClassifier(max_depth=2, random_state=0).fit(X_tr, y_tr)
print(export_text(tree, feature_names=names, decimals=1))
print("tree test accuracy:", round(tree.score(X_te, y_te), 4))
logreg = LogisticRegression().fit(X_train, y_train) # scaled features
top = sorted(zip(names, logreg.coef_[0]), key=lambda t: -abs(t[1]))[:3]
print("logistic regression, largest coefficients:", [(n, round(float(c), 3)) for n, c in top])
forest = RandomForestClassifier(n_estimators=100, random_state=0).fit(X_train, y_train)
print("random forest:", len(forest.estimators_), "trees,",
sum(t.tree_.node_count for t in forest.estimators_), "nodes in total")
print("forest test accuracy:", round(forest.score(X_test, y_test), 4))
imp = permutation_importance(forest, X_test, y_test, n_repeats=5, random_state=0)
top = sorted(zip(names, imp.importances_mean), key=lambda t: -t[1])[:3]
print("permutation importance:", [(n, round(float(v), 4)) for n, v in top])|--- Age <= 42.5
| |--- NumOfProducts <= 2.5
| | |--- class: 0
| |--- NumOfProducts > 2.5
| | |--- class: 1
|--- Age > 42.5
| |--- IsActiveMember <= 0.5
| | |--- class: 1
| |--- IsActiveMember > 0.5
| | |--- class: 0
tree test accuracy: 0.8365
logistic regression, largest coefficients: [('Age', 0.752), ('IsActiveMember', -0.518), ('Germany', 0.355)]
random forest: 100 trees, 223636 nodes in total
forest test accuracy: 0.867
permutation importance: [('Age', 0.0821), ('NumOfProducts', 0.0557), ('IsActiveMember', 0.0317)]What the three churn models reveal
- The depth-2 tree is readable in four rules: customers aged 42 or younger with one or two products are predicted to stay and those with three or four to leave; over 42, inactive members are predicted to leave and active ones to stay. It scores 0.8365 on the test set.
- The logistic regression's largest coefficients are Age (+0.752), IsActiveMember (−0.518) and Germany (+0.355): on scaled features, older customers, inactive members and German customers lean towards leaving.
- The random forest holds over 220,000 nodes across its 100 trees, the video's "very difficult to monitor", and scores the highest test accuracy of the three, 0.867.
- Permutation importance opens the box a little: shuffling Age costs the forest about 8 points of accuracy, NumOfProducts about 6 and IsActiveMember about 3, the same features the white box models use.
White box vs black box models
| White box | Black box | |
|---|---|---|
| Examples from the video | decision tree, linear regression | random forest, XGBoost, ANN, CNN, RNN |
| Can you follow one prediction? | yes, a path of splits or a weighted sum | not by inspection |
| Accuracy on the churn data | 0.8365 (depth-2 tree) | 0.867 (random forest), about 0.86 (ANN) |
| How you explain it | read the model | explainable AI: importances, SHAP, LIME |
Where you use white box models
- Regulated decisions such as loans and insurance, where a customer can ask why they were refused.
- Medicine, where a doctor has to check the reasons behind a risk score.
- A first model on new data, to learn which features matter before training a black box.
Related
- Previous: Hidden layers and neurons with Keras Tuner
- Next: Convolutional neural networks (CNN)
- See also: Decision tree classifier, Random forest
- Reference: Permutation feature importance in the scikit-learn user guide
- Set
max_depth=4on the tree and count how many rulesexport_textprints now. - Print
forest.feature_importances_.round(3)and compare its ranking with the permutation importance. - Change
n_estimators=100to10and compare the node count and the test accuracy.
You understood something today that you didn't yesterday.