
Experiment tracking with MLflow
Experiment tracking records each run of your app with its settings and its scores, so you can look back and tell which version answered best instead of trusting memory.
Last updated: 15 Oct, 2026 · LLMOps
The Packaging: setup.py, pyproject and requirements lesson finished a project you can install and run. Once it runs, every change to a prompt, a model or a retrieval setting produces a slightly different app, and you need a record of which change helped. MLflow is the open-source tool for that record. The LLM Evaluation with MLflow and Dagshub video uses MLflow to track runs, compare performance metrics and find which model is best. Two things in that video are not in this lesson: its application calls an OpenAI model, so it needs a key, and it logs its runs to a hosted Dagshub repository rather than to disk. The calls you will write here are the same ones, start_run, log_param and log_metric, pointed at a local folder with no key and no account. The hosted server the video uses is the subject of A remote tracking server, at the end of this part.
What a run records
MLflow stores one run per execution, and a run holds three kinds of value. A parameter is a setting you chose, such as the model name or a temperature. A metric is a number you measured from that run, such as the length of the answer or a quality score. A tag is a label you attach, such as the lifecycle stage. Runs are grouped under a named experiment.
Installing MLflow
MLflow is the only library this part needs, and it is the one the whole course runs on. Pin the version so the file-store behaviour below is the behaviour you get.
pip install "mlflow==3.17.1"No key and no account are needed. Everything in this lesson writes to a folder on your own machine. The one optional key in this course is a LangSmith key, in Tracing a run with LangSmith, and that lesson is read rather than run.
Pointing MLflow at a local store
Syntax: a tracking URI tells MLflow where to write. A local file store lives in a ./mlruns folder, so nothing leaves your machine and no key is needed.
import os
os.environ["MLFLOW_DISABLE_AGENT_HINT"] = "1"    # hush MLflow's agent hint while you learn
os.environ["MLFLOW_ALLOW_FILE_STORE"] = "true"   # 3.17 needs this opt-in for a local ./mlruns store
import shutil
shutil.rmtree("mlruns", ignore_errors=True)      # start every run from an empty store
os.makedirs("mlruns/.trash", exist_ok=True)

import mlflow
mlflow.set_tracking_uri("file:./mlruns")
mlflow.set_experiment("shop-assistant")MLFLOW_ALLOW_FILE_STORE=true, as the setup does. For anything long-lived the project recommends a database backend such as sqlite:///mlflow.db, which takes the same calls; the file store is kept here because it is the simplest thing to read and delete while learning.Logging a run
Open a run with start_run, then log its parameters, metrics and tags inside the block. The stand-in answers first, and both metrics are measured from the reply it returned, so the numbers in the run are produced by the run rather than typed in. When the block ends the run is closed and written to ./mlruns.
A real run would vary a setting such as the temperature, which only a real model can honour. The stand-in here has no temperature, so it takes a style instead, and changing it changes the answer. That keeps the comparison honest: every number below came out of the code on this page.
# the stand-in answers in one of two styles, so the setting a run records changes the answer
FACT = "Refunds are issued within 30 days of delivery."

def answer(style):
    if style == "short":
        return FACT
    return "Thanks for asking! " + FACT + " Let me know if there is anything else."

def extra_words(reply):
    # how many words the reply adds beyond the fact it was handed
    return len(reply.split()) - len(FACT.split())
# one run records the setting it used and the numbers measured from that run's own answer
reply = answer("short")

with mlflow.start_run(run_name="baseline"):
    mlflow.log_param("model", "shop-stand-in")
    mlflow.log_param("style", "short")
    mlflow.log_metric("answer_length", len(reply.split()))
    mlflow.log_metric("extra_words", extra_words(reply))
    mlflow.set_tag("stage", "evaluation")

print("reply       :", reply)
print("answer_length:", len(reply.split()))
print("extra_words  :", extra_words(reply))
reply       : Refunds are issued within 30 days of delivery.
answer_length: 8
extra_words  : 0
Reading the runs back and comparing them
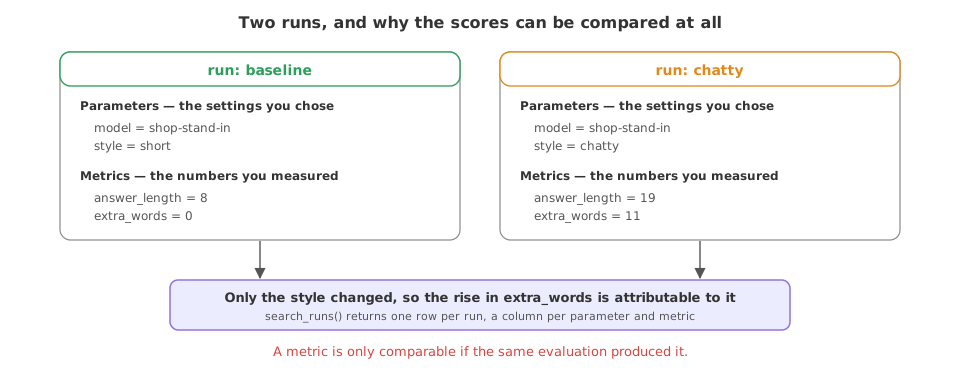
The point of tracking is comparison. Logging a second run under the same experiment, with one setting changed, and reading both back with search_runs gives a table where the effect of that setting is plain to see: the chatty style adds eleven words the fact did not need.
# a second run with the one setting changed, so there is something to compare
reply = answer("chatty")

with mlflow.start_run(run_name="chatty"):
    mlflow.log_param("model", "shop-stand-in")
    mlflow.log_param("style", "chatty")
    mlflow.log_metric("answer_length", len(reply.split()))
    mlflow.log_metric("extra_words", extra_words(reply))
    mlflow.set_tag("stage", "evaluation")

# search_runs reads every run of the experiment back as a DataFrame
runs = mlflow.search_runs(experiment_names=["shop-assistant"])
print("runs recorded:", len(runs))
for _, r in runs.sort_values("params.style").iterrows():
    print(f'  style={r["params.style"]:<7} answer_length={r["metrics.answer_length"]:.0f}  extra_words={r["metrics.extra_words"]:.0f}')
runs recorded: 2
  style=chatty  answer_length=19  extra_words=11
  style=short   answer_length=8  extra_words=0
What the two runs showed
- Each run kept its own setting and its own measurements, and only
stylediffered between them, so the rise inextra_wordsfrom 0 to 11 is attributable to that one change. - Both metrics were computed from the reply, not chosen by hand, which is the only reason the comparison means anything.
search_runsreturned a DataFrame with a column per parameter, metric and tag, which is what lets you sort, filter and compare.- Nothing needed a key. The model was a stand-in and the store was a local folder, so the mechanics of tracking are what you practised.
Parameters, metrics and tags
| Parameter | Metric | Tag | |
|---|---|---|---|
| Holds | A setting you chose | A number you measured | A label |
| Example | model, temperature | faithfulness, latency | stage=evaluation |
| Changes per run | Usually | Yes | Rarely |
| Logged with | log_param | log_metric | set_tag |
Where you use experiment tracking
- A prompt or model sweep, where you run several settings and keep the scores side by side.
- A regression check, confirming a change did not quietly lower a score you cared about.
- A handover, where the recorded runs show a teammate what was tried and how it did.
faithfulness from one scoring method on one run and a different method on the next makes the numbers look comparable when they are not. Fix the evaluation, then vary the app.Related
- Add a third run with a style of your own, such as one that answers in two sentences, and read all three back sorted by
extra_words. - Log the reply itself with
mlflow.set_tag("reply", reply)and confirm it comes back as a column. - Open
mlruns/and find the params and metrics of one run written as plain files on disk.
Every expert started right here.