
The signals to watch
The signals that tell you a live LLM app is healthy are a small set: token cost, latency, the failure or error rate, user feedback, and quality drift over time.
Last updated: 15 Oct, 2026 · LLMOps
The LangGraph and AutoGen Studios lesson covered debugging while you build. Once an app is live, you stop reading individual runs and watch a handful of numbers across all of them. The monitor dashboard in the LangSmith LLMOps platform video already graphs most of these, and the Detailed LLMOps Project Lifecycle video reduces observability to logging, metrics and alerting: the signals below are the metrics, and an alert fires when one crosses a line you set.
The five signals
| Signal | Why it matters | How you watch it |
|---|---|---|
| Token cost | Every call is a bill; a quiet rise in tokens per call or in call count is money leaking. | Total tokens and cost per call on the monitor dashboard; alert on a daily spend ceiling. |
| Latency | It is what the user waits for, and a slow step hides inside a chain that still returns an answer. | Latency per run and per step in the trace; alert on a p95 threshold. |
| Failure / error rate | Model timeouts, rate limits and bad tool calls fail silently from the user's side. | Trace and model success rate; alert when the error rate crosses a few percent. |
| User feedback | The only signal that says the answer was useful to the person, which no metric can infer. | Thumbs or ratings attached to a run as feedback; watch the share of negative feedback. |
| Quality drift | A model update or changing data erodes answers with no error to catch it. | Re-run your evaluation set on a schedule and alert when a score drops. |
What to alert on
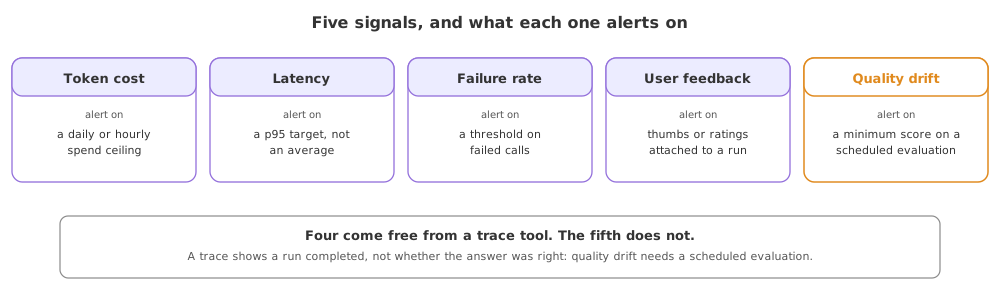
A metric you only look at is a metric you look at too late. Each signal needs a line that, when crossed, pages someone: a spend ceiling for cost, a p95 target for latency, an error-rate threshold, a floor on positive feedback, and a minimum score on the scheduled evaluation. Cost and error rate are the two that most often catch a problem first.
- Cost: a daily or hourly spend ceiling, so a runaway loop is caught in hours, not on the invoice.
- Latency: a p95 target rather than an average, meaning the time 95 of every 100 requests come in under, because the slow tail is what users notice.
- Errors: a threshold on the failure rate, since a provider outage or a hit rate limit shows up here first.
- Quality: a minimum score on a scheduled evaluation run, the only alert that catches a silent drop in answer quality.
Where you watch these signals
- A monitor dashboard such as LangSmith's or Langfuse's, which already graphs cost, latency and success rate from your traces.
- A scheduled evaluation job, so quality drift is a number on a graph and not a user complaint.
- An alerting channel, so a crossed threshold reaches a person instead of waiting to be noticed.
Related
- Previous: LangGraph and AutoGen Studios
- Next: Deployment choices, and why
- Quality metrics to run on the traffic: Promptfoo overview
- Reference: LangSmith documentation
- For an app you run, write down the five signals and the one number you would alert on for each.
- Check whether your monitor dashboard already shows cost, latency and error rate, and which signal is missing.
- Set up a tiny evaluation set you could re-run on a schedule to catch quality drift, even five examples to start.
Slow is fine. Stopping is the only problem.