
Observability in production
Observability in production is being able to see what a deployed LLM app did from the outside: every request it served, what went to the model, what came back, and where a slow or wrong answer was produced. It is the layer you reach for once the app is live and you cannot reproduce the problem yourself.
Last updated: 15 Oct, 2026 · LLMOps
The Versioning model, data and code lesson labelled the inputs to a result. In production you also watch the results as they happen. The end-to-end project, an Azure multimodal compliance engine built with LangGraph and LangSmith, adds two layers on top of the structured app this course built: an orchestration layer and an observability layer. This lesson takes each from that project.
The flow the traces describe
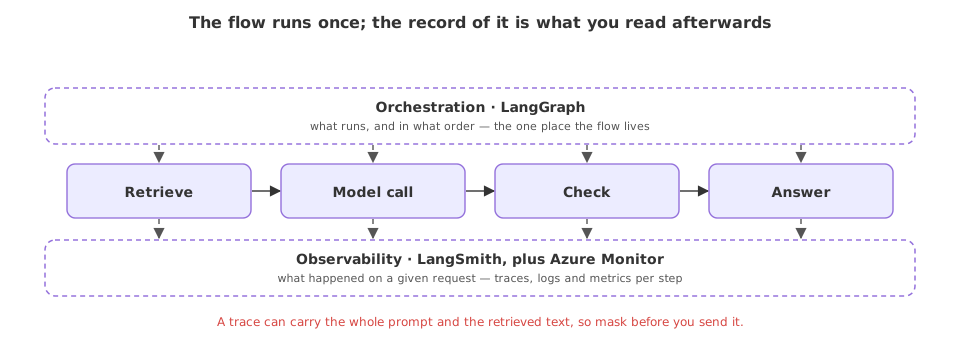
Before the traces make sense, one line on what they are tracing. The project runs several steps, retrieval, the model call, the checks, each in its own module, and LangGraph is the layer that runs them in order as one flow from the entry point. That ordering is the orchestration; it is the subject of The Azure deployment from the project. What matters here is that each of those steps is a step a trace can record.
What observability records
Observability answers "what happened on that request" after the fact. The project uses two tools for it. LangSmith traces the chain of thought: for each call it records what was sent to the model and what came back, so when the assistant gives a wrong answer you open the trace and see whether it retrieved the wrong document or the prompt instructions were confusing. Alongside it, the project wires in Azure Application Insights through Azure Monitor and OpenTelemetry, an industry-standard observability framework that tracks requests, errors and performance across the app and auto-captures every API request the FastAPI server handles.
Where each signal comes from
| What it answers | Where it comes from | |
|---|---|---|
| LangSmith trace | What happened on one request, step by step | The traced chain, per call |
| Azure Monitor | Request rates, errors and latency across all traffic | The hosting platform |
| OpenTelemetry | The instrumentation both read from | The app, instrumented once |
| A log line | The event and the fields you chose to record | Your own logger |
Where observability earns its keep
- A wrong answer in production, where a LangSmith trace shows whether retrieval or the prompt was at fault, the way the project uses it.
- App health, where Azure Monitor reports request rates, errors and latency across all the traffic rather than one request.
- A slow request, where the trace times each step, so you can see which one spent the seconds.
Related
- Previous: Versioning model, data and code
- Next: Project: the production assistant
- See also: Tracing a run with LangSmith
- See also: Why you monitor an LLM app
- Trace one request through the shop assistant and name every step the orchestration layer would run in order.
- Pick a wrong answer and write what a LangSmith trace would need to show for you to tell retrieval from prompt as the cause.
- List the three signals Azure Monitor would report for the app and why each matters in production.
You understood something today that you didn't yesterday.