
Tracing a run with LangSmith
A LangSmith trace is the recorded tree of one request through your chain: every prompt, model call and parser step, with the latency, the token count and the cost of each, captured automatically once tracing is switched on.
Last updated: 15 Oct, 2026 · LLMOps
The Why you monitor an LLM app lesson argued for a record of each request. LangSmith, built by the LangChain team, is the tool the LangSmith LLMOps platform video uses for that. The video calls it a platform to debug, test, evaluate and monitor chains and agents built on any LLM framework. The setup here is shown from the project so you can read what it does; it is not run, because it needs a LangSmith account and an API key.
Installing the client
Tracing rides along with the LangChain client, so there is nothing extra to run as a server.
pip install "langchain-openai==1.7.2" "langsmith==0.14.8" python-dotenvOptional key. This lesson is the one place in the course that needs an account: a free LangSmith key from smith.langchain.com, plus a model key for the chain to call. No other lesson needs either, so the code here is shown and read rather than run, and there is no captured output on the page. Set the key in a .env file and the snippets below work as written.
Switching tracing on
Two things turn a normal LangChain app into a traced one: an environment variable that enables tracing, and your LangSmith API key, which you create under settings in the LangSmith dashboard after signing up. A project name groups the runs so they land in one place. The key is read from a .env file rather than written into the code.
import os
from dotenv import load_dotenv
from langchain_openai import ChatOpenAI
from langchain_core.prompts import ChatPromptTemplate
from langchain_core.output_parsers import StrOutputParser

load_dotenv()                                    # LANGSMITH_API_KEY comes from your .env

# turn tracing on and point it at your LangSmith account (needs a key)
os.environ["LANGSMITH_TRACING"] = "true"
os.environ["LANGSMITH_PROJECT"] = "test llm app"
You sign up for a LangSmith account, create the API key under settings, and put it in the environment as above. Because the course uses no key, there is no captured trace to show here; the LangSmith dashboard is where the output appears.
The traced chain
The app itself is an ordinary LangChain chain: a prompt, a model and an output parser piped together, then invoked with a question and a context. Nothing in the chain mentions LangSmith. With the tracing variable set to true, each invoke is sent up as one trace on its own.
prompt = ChatPromptTemplate.from_messages([
    ("system", "You are a helpful assistant. Answer only from the given context."),
    ("user", "Question:{question}\nContext:{context}"),
])
model = ChatOpenAI(model="gpt-4o-mini")
chain = prompt | model | StrOutputParser()

# with tracing on, every invoke is sent to LangSmith as one trace
print(chain.invoke({"question": question, "context": context}))
LANGCHAIN_TRACING_V2 and LANGCHAIN_API_KEY and the chain used gpt-3.5-turbo. Both still work, but the current LangSmith documentation uses LANGSMITH_TRACING and LANGSMITH_API_KEY, and that model is being retired, so the code here follows the current release rather than the recording. The on-screen system prompt is also tidied slightly; the wording does not change what is traced.What the trace shows
In the dashboard, one run opens as a tree. The LangSmith LLMOps platform video walks it: the top node is the runnable sequence, under it the chat prompt template, then the chat model call, then the string output parser, each with its own input and output. The model node carries the detail you monitor on.
- The chain of calls, step by step, so you can open any node and read exactly what it received and returned.
- Latency, both for the whole run and per step. The run the clip opens on reports 1.77 seconds for the whole sequence, with 1.73 of those seconds in the model call.
- Token counts and cost for each model call, so a trace tells you what the request spent, not only what it answered.
- Success or error on each node, so a failed call is marked on the trace rather than lost in a stack trace.
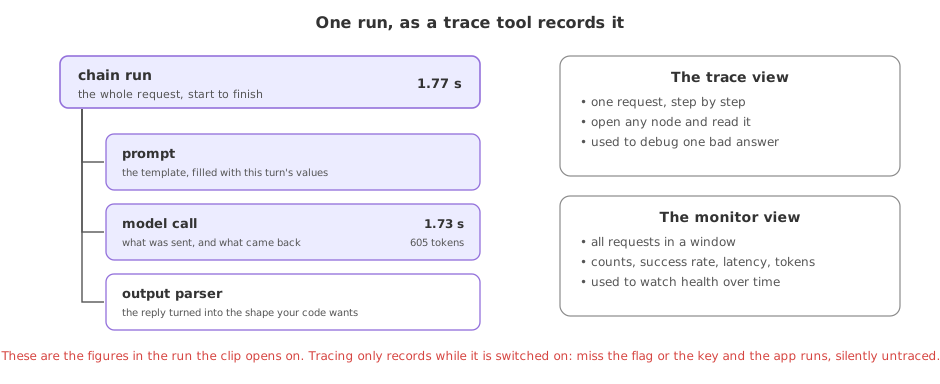
Traces and the monitor dashboard
LangSmith has two views of the same traffic. A trace is one request in full detail; the monitor view aggregates many requests into counts and graphs over a window such as the last hour.
| The trace view | The monitor view | |
|---|---|---|
| Scope | One request | All requests in a window |
| Shows | The step-by-step tree | Counts, success rate, latency, tokens |
| Used for | Debugging one bad answer | Watching the app's health over time |
Where you use LangSmith
- A LangChain or LangGraph app, where tracing is a pair of environment variables and no code change to the chain.
- Debugging a multi-step chain, where you need to see which node was slow, wrong or expensive.
- Watching a live app, where the monitor view tracks call count, latency and token cost as traffic flows.
LANGSMITH_TRACING is true and a valid key is set; miss either and the app runs fine but records nothing. The key is a secret, so it belongs in the environment, never in the code you commit.Related
- Previous: Why you monitor an LLM app
- Next: LangGraph and AutoGen Studios
- The observability concept in depth: Langfuse overview
- Reference: LangSmith documentation
- Sign up for a LangSmith account, create an API key under settings, and set the two environment variables in a scratch project.
- Run any LangChain chain you already have with tracing on, then open the run in the dashboard and expand each node.
- Find the latency and token count on one model node, and compare two runs in the monitor view over the last hour.
Little by little, you're building something great.