
Why you monitor an LLM app
Observability for an LLM app is being able to see, after a request has run, what the app sent to the model, what came back, how long it took, how many tokens it cost, and whether the answer was any good.
Last updated: 15 Oct, 2026 · LLMOps
The tracking lessons ended with A remote tracking server, which kept a record of training and evaluation runs you chose to log. A live app needs the same kind of record, but for every request a user makes, not for a run you started by hand. The Detailed LLMOps Project Lifecycle video returns to monitoring twice: once as debugging, while you are still building and fixing, and again as the ongoing maintenance the board numbers as its last stage, and sums observability up as logging, metrics and alerting.
What you cannot see without it
An LLM app is a chain of steps: a prompt is filled in, a model is called, the reply is parsed, and often a retriever or a tool runs in between. Each step can be slow, expensive or wrong, and none of it is visible from the final answer alone. Without a record you are left guessing why a reply was bad or why a bill grew.
- Cost is a real bill now. Every call spends tokens, and a slow drift in prompt length or call count shows up as money. The only way to control it is to measure it per call.
- Latency is what the user feels. A chain that calls a model twice and a retriever once can be slow for reasons that never appear in the text it returns.
- Bad answers happen even when nothing errors. The app returns a confident, wrong reply, and the only way to find it later is to have the input, the context and the output written down.
- Drift is the slow one. The model provider updates a version, your data changes, a prompt that worked starts to miss, and quality falls without a single error in the logs.
- No record is the default. If you did not capture the run, the user's session is gone, and a complaint about a wrong answer is impossible to reproduce.
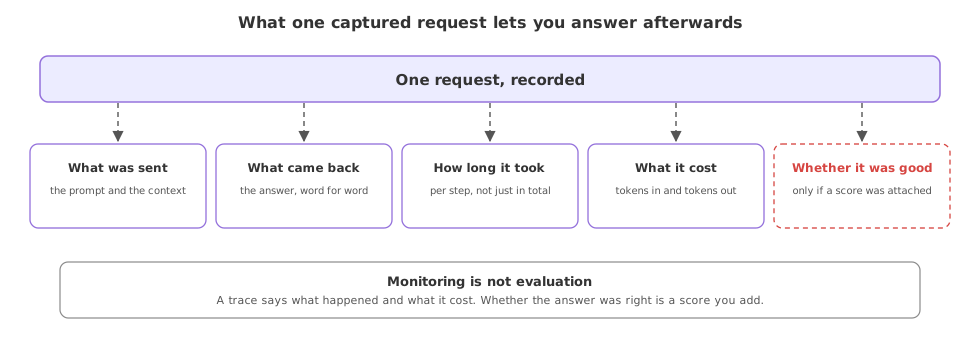
What observability buys you
With a trace of each request you can open one bad reply and walk the exact chain that produced it, and with metrics across many requests you can watch cost, latency and the error rate move over time. The LangSmith LLMOps platform video shows both views from a single traced run: the detailed trace of one request, and a dashboard that counts calls, success rate, latency and tokens across an hour.
| Without observability | With it | |
|---|---|---|
| A bad answer | You cannot reproduce it | You open its trace and read the inputs |
| A slow response | You guess which step is slow | The trace times each step |
| The monthly bill | A surprise at the end | Tokens and cost tracked per call |
| Quality over time | Noticed when users complain | Watched on a metric before they do |
Where you use observability
- Any app that calls a paid model, where tokens and latency per request decide the bill and the user experience.
- A RAG or agent chain with several steps, where the failure is somewhere in the middle and the final answer does not say where.
- A support or production assistant that has to be debugged from a user complaint days after the session ran.
Related
- Previous: A remote tracking server
- Next: Tracing a run with LangSmith
- The observability concept in depth: Langfuse overview
- Reference: LangSmith documentation
- Open one of your own LLM apps and list the steps a single request runs through. Mark which ones you can currently see after the fact.
- For a recent bad answer, write down what you would need to reproduce it: the input, the retrieved context, the prompt and the model reply.
- Read the three signals the LangSmith LLMOps platform video watches: trace count, latency and total tokens, and note which one maps to your bill.
Every expert started right here.