
Observing the project in production
The running project is watched two ways. LangSmith traces each audit as a tree of the steps it took, and Azure Application Insights, through OpenTelemetry, records every API request, its latency and its errors automatically. The video calls Application Insights the flight data recorder for the app.
Last updated: 15 Oct, 2026 · LLMOps
The workflow defined what runs. This lesson is how you see what happened once it is live, the monitoring part of the lifecycle applied to the real project.
Two layers of watching
| LangSmith | Azure Application Insights | |
|---|---|---|
| Answers | What happened inside one audit | How the whole service is behaving |
| Shows | The trace tree: retrieve, model call, parse | Request count, latency, errors, live maps |
| Set up by | Two env vars, a key and a project name | One connection string and OpenTelemetry |
| Used for | Debugging one wrong verdict | Watching health and spend over time |
from azure.monitor.opentelemetry import configure_azure_monitor
import os

# one call wires OpenTelemetry to Application Insights; every FastAPI request is
# then captured automatically, with no per-endpoint logging to write by hand
configure_azure_monitor(
    connection_string=os.getenv("APPLICATIONINSIGHTS_CONNECTION_STRING"),
)
Once this is set, Application Insights auto-captures every request the FastAPI backend serves: how many users hit the service, how long each audit took, where it failed. The video stresses that nothing has to be logged per endpoint by hand; the instrumentation does it, which is why it calls it a flight recorder.
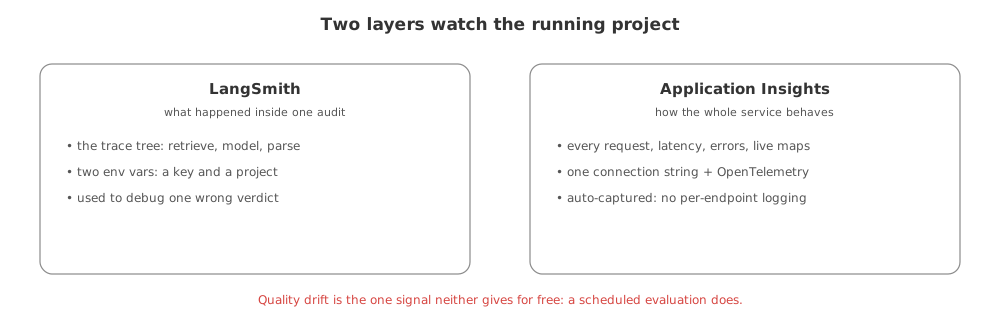
The signals the project watches
- Latency, because one audit was 146 seconds, most of it in indexing; a rise means something upstream slowed.
- Errors, the system_errors the nodes record plus the request failures Application Insights sees.
- User activity, how many audits are run, which Application Insights tracks without extra code.
- Quality drift, which neither tool gives for free: it needs the scheduled evaluation from Evaluation in the lifecycle.
Related
- Previous: The workflow that wires the nodes
- Next: The backend, and a real audit run
- See also: Why you monitor an LLM app
- Say which of the two tools you would open first for a single wrong verdict, and which for a 3am alert.
- Name the one signal neither tool gives you for free, and what produces it.
Slow is fine. Stopping is the only problem.