Bias and variance
Bias and variance are the two sources of a model's error: bias is how far the model is from the truth on the data it learned from, and variance is how much its predictions change when the data changes.
Last updated: 05 Oct, 2026 · scikit-learn 1.9.1
The Overfitting and underfitting lesson tagged overfitting as low bias and high variance. This lesson gives the definitions behind those words and applies them to three models.
Defining bias
The video starts from a model with 90% accuracy on the training data and 70% on the test data. Most people call it overfitting, which means low bias and high variance. Why is bias tied to the training data and variance to the test data?
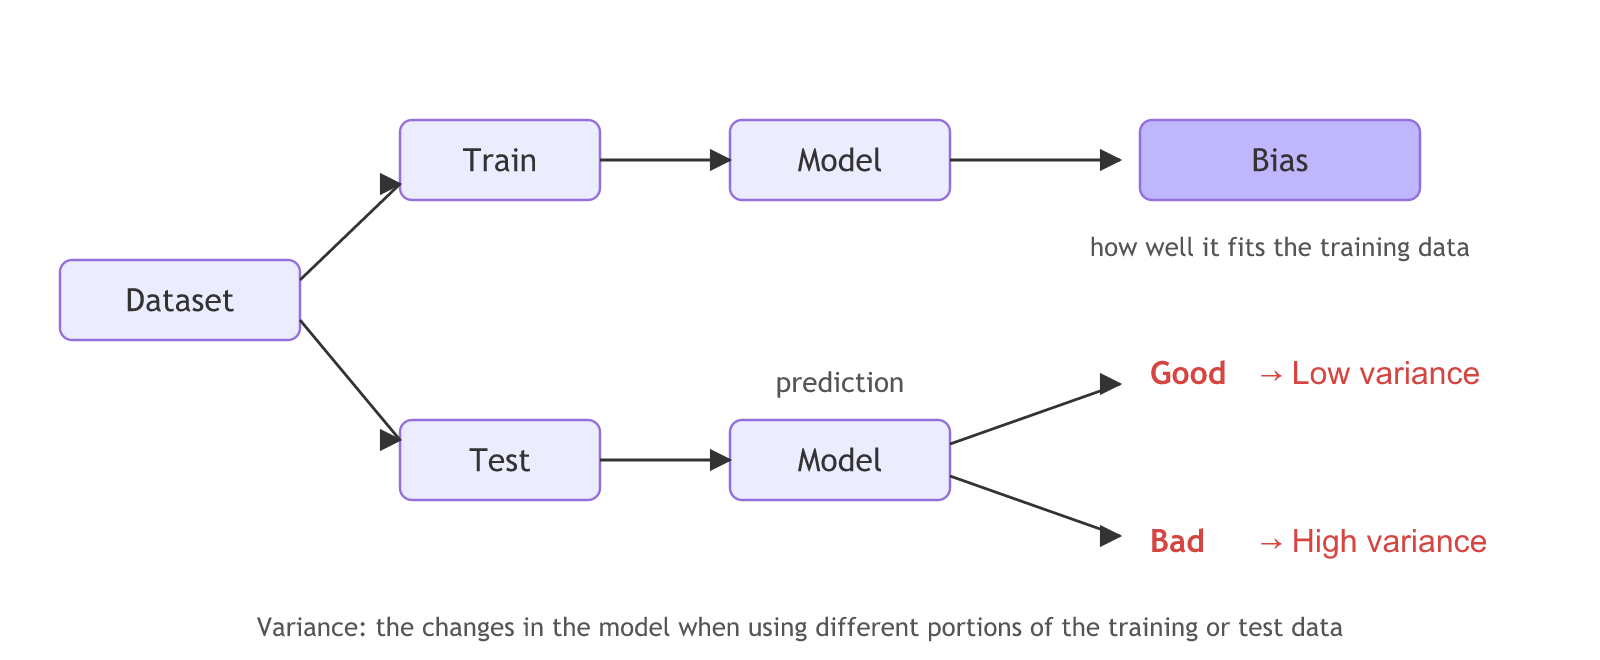
The definition from the board: bias is a phenomenon that skews the result of an algorithm in favor or against an idea. Here the idea is the training data set. A model trained on it may fit it well or badly.
- Low bias: the model performs well on the training data.
- High bias: the model performs badly on the training data, its errors are large even on the points it learned from.
The board marks model 2 (60% train, 55% test) "high bias, high variance"; with the standard definitions it is high bias and low variance, since its scores are poor but almost equal.
Defining variance
The definition from the board: variance refers to the changes in the model when using different portions of the training or test data. The data set is divided into a training part and a test part. Training on the training part is where bias is read. Then the model makes predictions on the test data, or on other training data it has not seen.
- Low variance: the predictions on the new data are good, so the accuracy on the test data is also good.
- High variance: the predictions on the new data are bad, so the score drops when the data changes.
Judging three models by bias and variance
The video's second set of three models, with the verdicts read from the definitions:
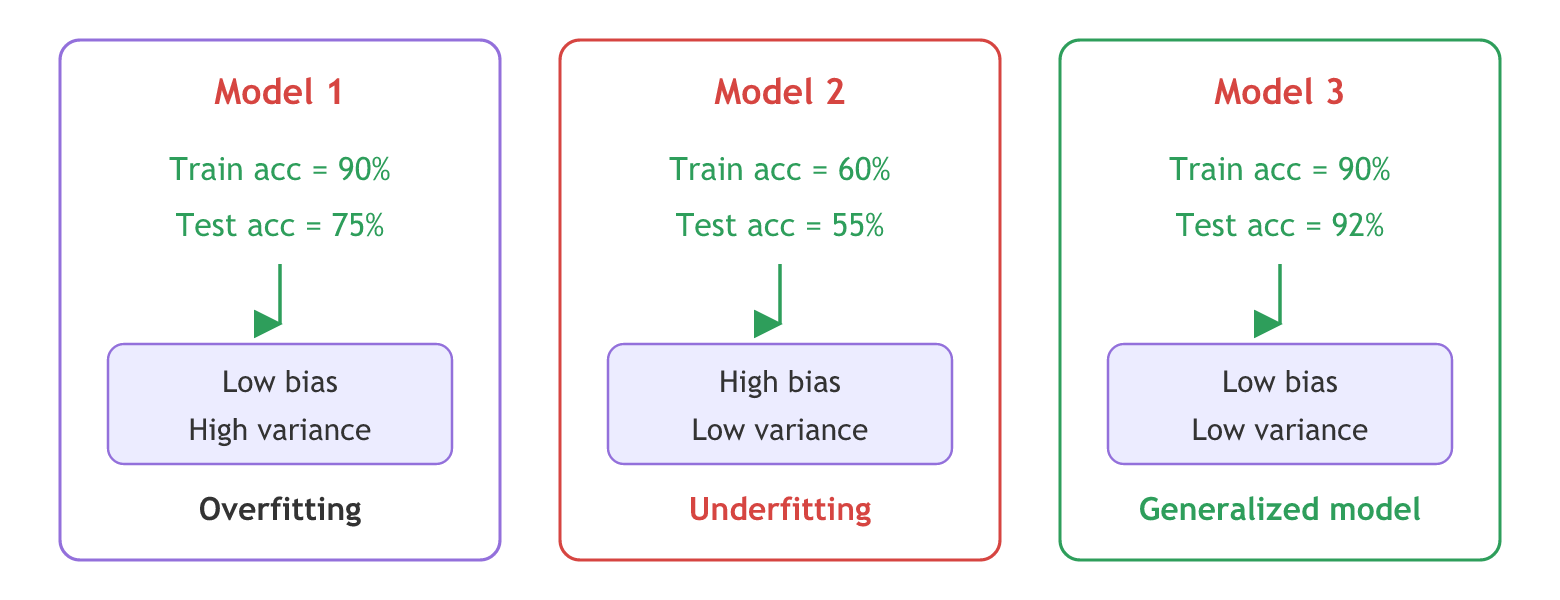
- Model 1, 90% train and 75% test. The training accuracy is good, so low bias. The test accuracy is much lower than the training accuracy, so high variance. This is overfitting.
- Model 2, 60% train and 55% test. The training accuracy is poor, so high bias. The test score barely moves from it, so the variance is low. This is underfitting.
- Model 3, 90% train and 92% test. Low bias and low variance: "this gives me a generalized model and this is what is our aim".
Measuring bias and variance in code
The variance definition talks about different portions of the training data, and that can be run. The code draws 10 different training samples of 30 points from the same curve as the overfitting lesson, fits the same model on each sample and records the 10 predictions at x = 2, where the true value of the curve is 6. How far the average prediction lands from 6 is the bias. The spread (standard deviation) of the 10 predictions measures the variance.
import numpy as np
from sklearn.pipeline import make_pipeline
from sklearn.preprocessing import PolynomialFeatures, StandardScaler
from sklearn.linear_model import LinearRegression

rng = np.random.RandomState(0)
X = rng.uniform(-3, 3, 300).reshape(-1, 1)
y = 0.5 * X[:, 0] ** 2 + X[:, 0] + 2 + rng.normal(0, 1, 300)
true_value = 0.5 * 2 ** 2 + 2 + 2          # the curve at x = 2 is 6.0

for degree in [1, 2, 15]:
    preds = []
    for portion in range(10):              # 10 different portions of the data
        rows = rng.choice(300, size=30, replace=False)
        model = make_pipeline(PolynomialFeatures(degree=degree), StandardScaler(), LinearRegression())
        model.fit(X[rows], y[rows])
        preds.append(model.predict([[2.0]])[0])
    preds = np.array(preds)
    bias = preds.mean() - true_value
print(f"degree {degree:2}: average prediction {preds.mean():.2f}, bias {bias:+.2f}, spread {preds.std():.2f}")degree 1: average prediction 5.03, bias -0.97, spread 0.72 degree 2: average prediction 5.96, bias -0.04, spread 0.30 degree 15: average prediction 6.57, bias +0.57, spread 1.98
What the bias and spread mean
- Degree 1 has high bias. Its average prediction is 5.03 against a true 6.00, a bias of −0.97: whatever sample it gets, a straight line misses the bend.
- Degree 2 has low bias and low variance. A bias of −0.04 and the smallest spread, 0.30. Every sample gives nearly the same, nearly right answer.
- Degree 15 has high variance. The spread is 1.98, almost seven times that of degree 2: each new portion of the data gives a very different curve. This is the "changes in the model when using different portions" from the definition.
- Lowering one tends to raise the other. Going from degree 1 to 15 trades bias for variance; the generalized model sits in between.
Bias vs variance
| Bias | Variance | |
|---|---|---|
| Read from | the training data | new data: test data or other training samples |
| Low means | the model fits the training data well | predictions stay good and steady on new data |
| High means | large errors even on the training data | predictions drop or swing when the data changes |
| High value comes with | underfitting | overfitting |
| Usual fix | a more flexible model, more features | more data, a simpler model, regularization |
Where you use bias and variance
- Diagnosing a model. A low training score points to bias; a big drop from training to test points to variance. The fixes are opposite, so the diagnosis comes first.
- Setting regularization strength. In Ridge regression a larger λ adds a little bias to remove variance.
- Reading interview questions. "Overfitting is low bias and high variance" is the standard answer; the definitions above are the reason behind it.
Related
- Previous: Overfitting and underfitting
- Next: Ridge regression
- Reference: scikit-learn: Validation curves
- Change
size=30tosize=150. More points in each portion shrink the spread of degree 15 the most. - Change the degrees to
[1, 2, 3, 5, 15]. The spread is smallest around degree 2 and 3 and grows quickly after that. - Predict at x = 2.9 instead of 2: change
[[2.0]]to[[2.9]]andtrue_valueto0.5 * 2.9 ** 2 + 2.9 + 2. Near the edge of the data, degree 15 swings even more.
Little by little, you're building something great.