Supervised and unsupervised learning
Supervised learning is a type of machine learning that trains on data with a known output column, while unsupervised learning finds structure in data that has no output column.
Last updated: 05 Oct, 2026 · scikit-learn 1.9.1
Most business problems fall into one of these two. Knowing which one you have tells you which family of algorithms to reach for, and how to check the result.
Learning from an output column
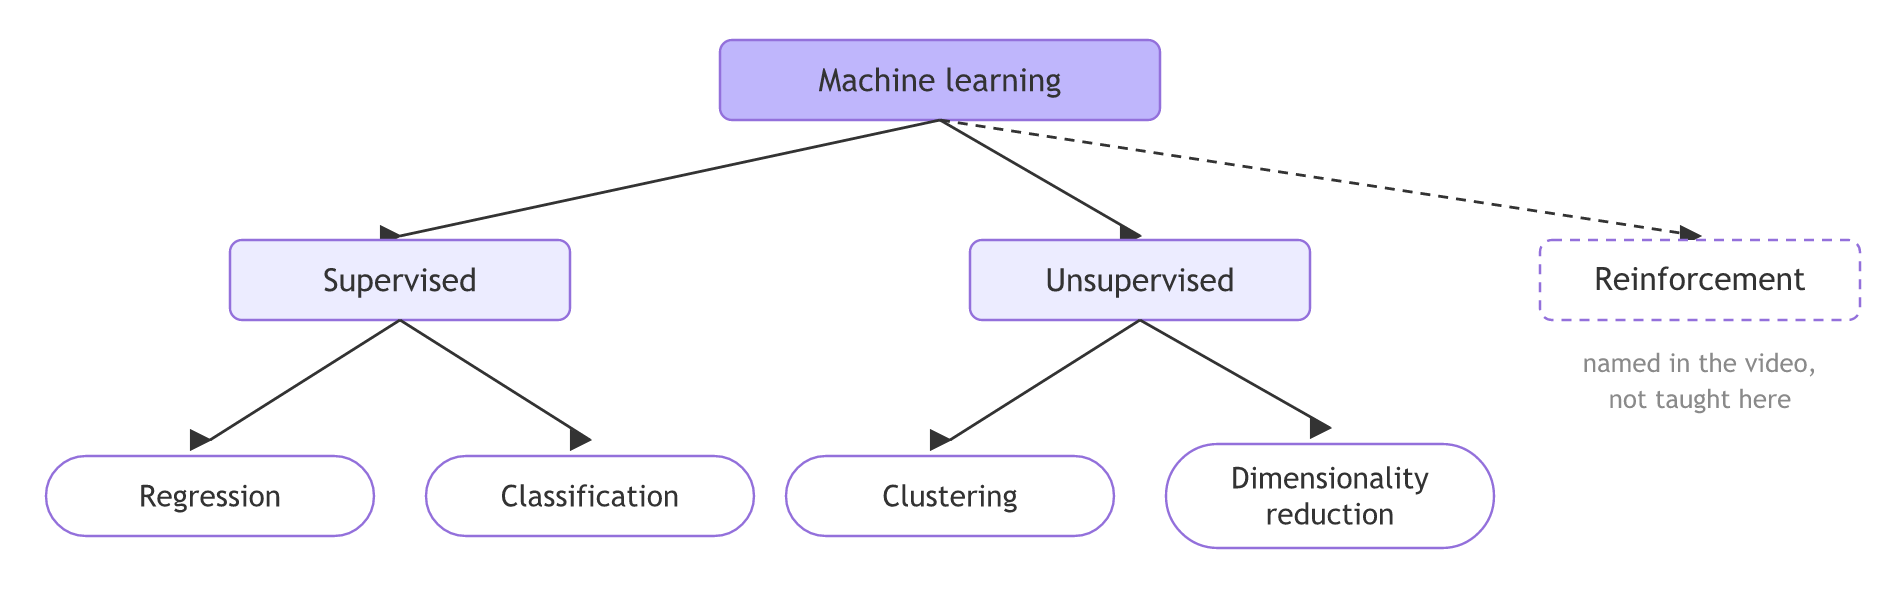
The majority of business use cases fall into supervised or unsupervised machine learning. Supervised learning solves two kinds of problem, regression and classification. Unsupervised learning solves two others, clustering and dimensionality reduction. A third type, reinforcement learning, is named in the video and left for later; this course does not cover it.
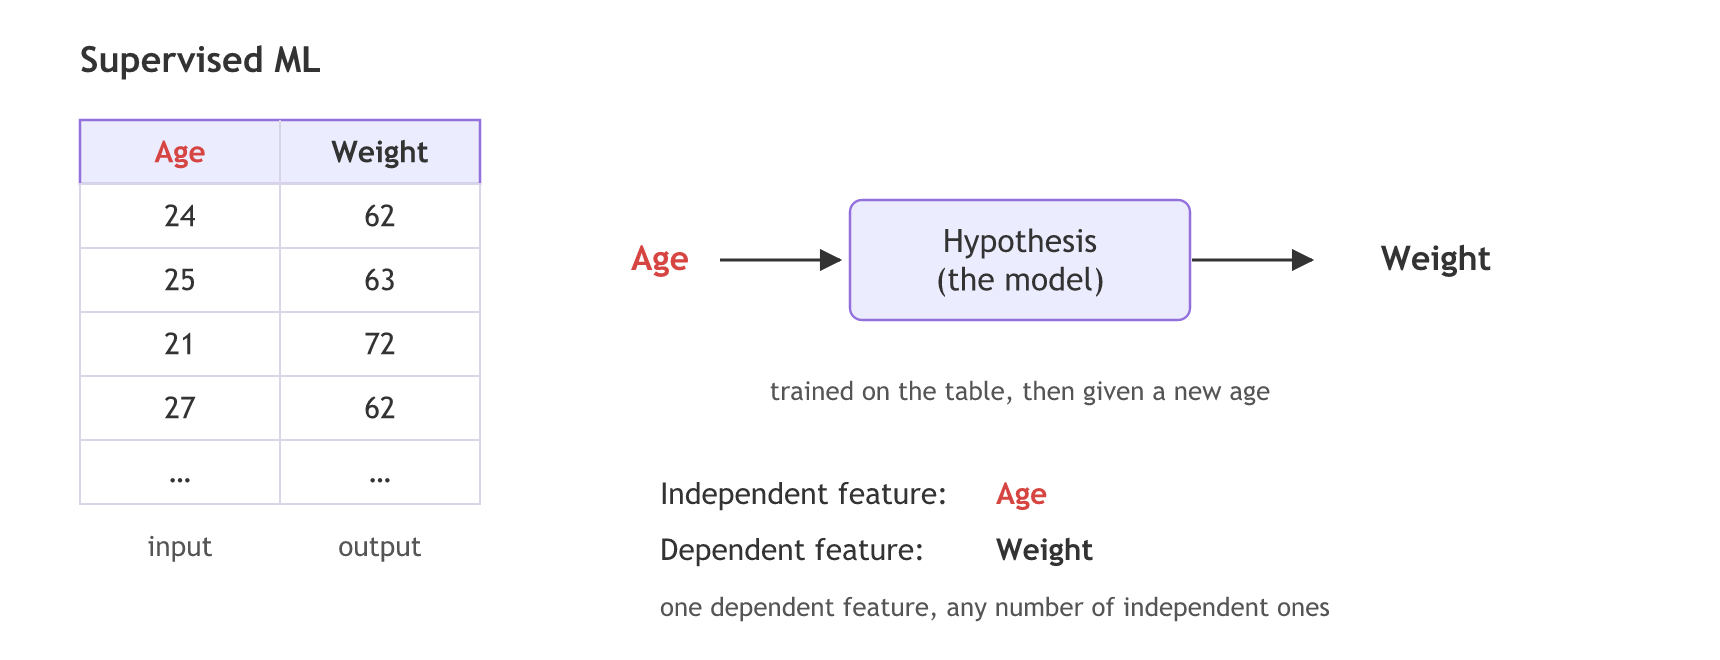
Take the video's dataset of age and weight: 24 and 62, 25 and 63, 21 and 72, 27 and 62. The task is to train a model on this data so that, given a new age, it outputs a weight. That trained model is also called the hypothesis.
- Independent features are the inputs the model trains on. Here: age.
- The dependent feature is the output to predict. Here: weight. It is called dependent because it changes when the input changes.
- A supervised problem has one dependent feature and any number of independent features.
Regression: a continuous output
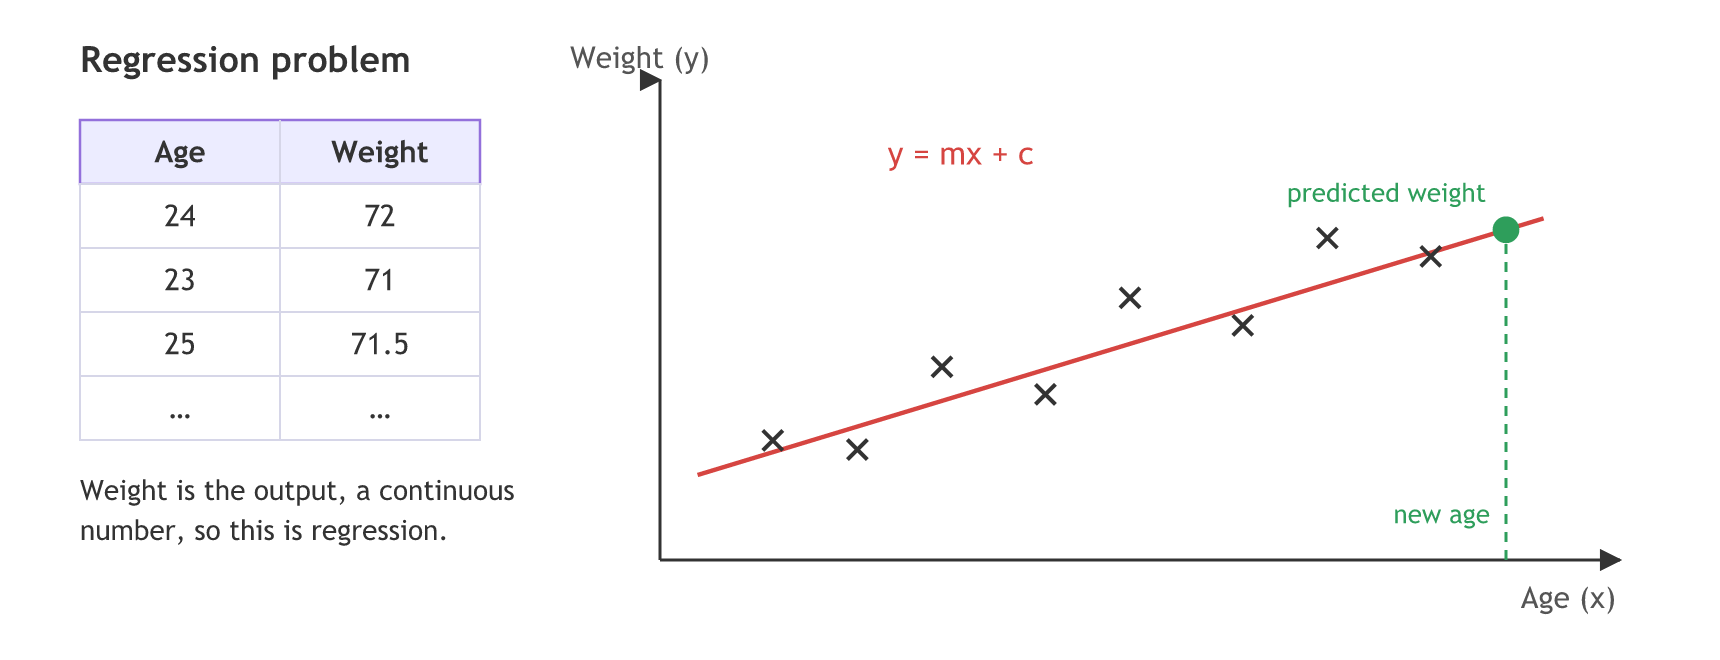
The video's second table has ages 24, 23 and 25 with weights 72, 71 and 71.5. The output is a continuous number, so this is a regression problem. Plot the data as a scatter, draw a straight line y = mx + c through it, and read a new age's predicted weight off the line. That line is linear regression, the first algorithm of the course.
The notes for this lesson use a house price table instead: a house of size 5000 with 5 rooms sells for 450K, one of size 6000 with 6 rooms for 500K. Size and rooms are the independent features, price the dependent one, and price is continuous, so this is regression too.
Classifying, clustering and reducing dimensions
Classification: fixed categories
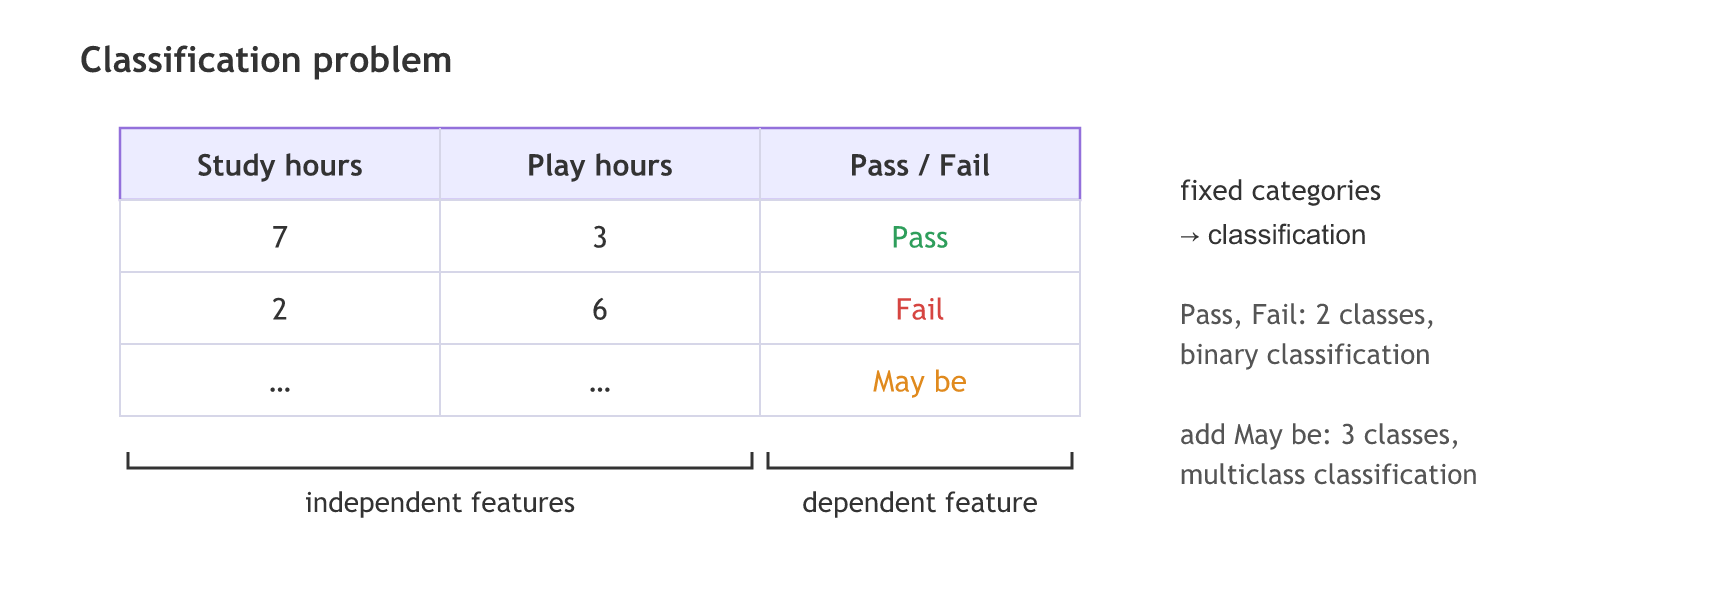
The independent features are the number of study hours, play hours and sleeping hours. The dependent feature is pass or fail. When the output has a fixed number of categories, the problem is classification: two categories make it binary classification, more than two make it multiclass classification. The board leaves the feature cells blank. The notes fill in two rows, with study and play hours: 7 hours of study and 3 of play is a pass, 2 of study and 6 of play is a fail. They also add a third answer, "may be", which turns the binary problem into a multiclass one.
Clustering: grouping without an output
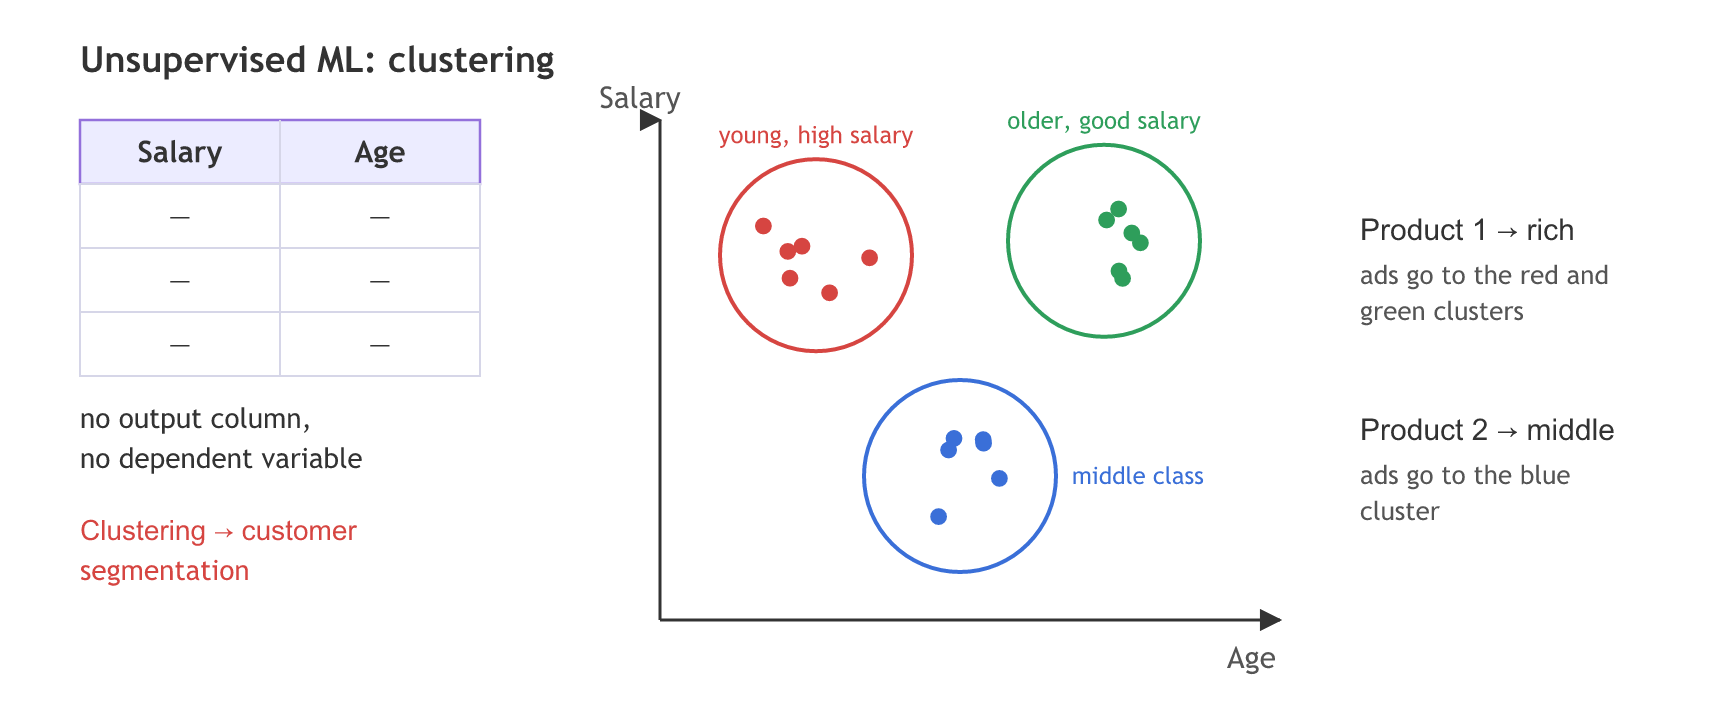
Now a dataset of salary and age with no output variable and no dependent variable. Clustering finds groups of similar people. In the video's example three clusters appear: people who are young with a high salary, people who are older with a good salary, and a middle-class group whose salary does not rise much with age.
This is customer segmentation. A company launching product 1 for rich customers and product 2 for middle-class customers can target each product's ads at the matching cluster. Later, regression or classification can run on each segment. The key word is grouping: clustering is not classification, because there is no output feature to learn.
The notes give a second version: an e-commerce company with each customer's salary and a spending score from 1 to 10, such as 20000 and 9, or 45000 and 2. Plotted, the customers fall into clusters, and the company can email each cluster its own discount.
Dimensionality reduction: fewer features
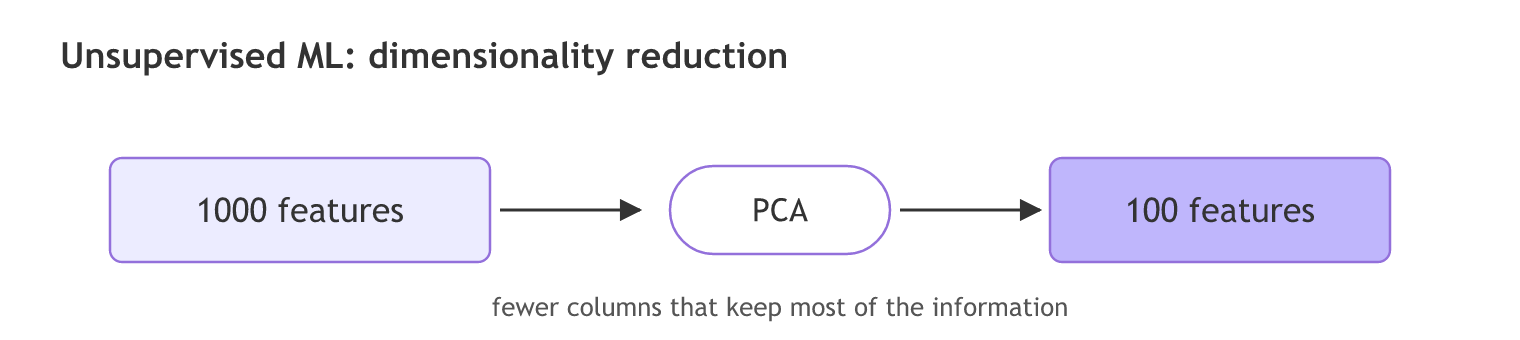
With 1000 features, can the data be squeezed into fewer dimensions, say 100 features, while keeping most of the information? Dimensionality reduction algorithms such as PCA do that. The video also names LDA here. PCA ignores labels, so it is unsupervised. LDA (linear discriminant analysis) needs the class labels to find its directions, so it is a supervised method, even though it also reduces dimensions.
Sorting the algorithms by type
The notes close the topic with the algorithms sorted by type. The supervised ones from decision tree onwards solve both classification and regression:
| Type | Algorithms in the notes | Also in this course |
|---|---|---|
| Supervised, regression | Linear regression, ridge and lasso, ElasticNet | Polynomial regression |
| Supervised, classification | Logistic regression | Naive Bayes |
| Supervised, both | Decision tree, random forest, AdaBoost, XGBoost | K nearest neighbours, SVM |
| Unsupervised | K-means, hierarchical clustering, DBSCAN clustering | PCA, silhouette score |
Reinforcement learning, the third type, has its own heading in the notes and no algorithms under it; this course does not cover it.
Fitting with and without an output in scikit-learn
scikit-learn shows the difference in one argument. A supervised model is trained with fit(X, y): features and the output. An unsupervised model is trained with fit(X): features only. To run this, install the libraries first (Installing scikit-learn).
The supervised fit
import numpy as np
from sklearn.linear_model import LinearRegression

age = np.array([[24], [25], [21], [27]])     # independent feature, as a column
weight = np.array([62, 63, 72, 62])          # dependent feature
model = LinearRegression().fit(age, weight)  # fit(X, y)
The unsupervised fit
from sklearn.cluster import KMeans

# age and salary (in thousands), no output column
people = np.array([[23, 90], [24, 95], [45, 120], [50, 130], [35, 30], [38, 35]])
kmeans = KMeans(n_clusters=3, n_init=10, random_state=0)
groups = kmeans.fit_predict(people)          # fit(X) only, then a group per row
Running both fits
print("predicted weight for a new age of 23:", round(model.predict([[23]])[0], 1))
print("cluster of each person:", groups)
print("number of clusters found:", len(set(groups)))predicted weight for a new age of 23: 66.9 cluster of each person: [2 2 0 0 1 1] number of clusters found: 3
Reading the two results
- The supervised model returns a number. It learned from the weights in the table, so it can predict one for an age it has not seen. Simple linear regression explains the line behind it.
- The clustering returns group numbers. The two young high earners share one number, the two older high earners another, and the two low earners a third. The numbers are names, not ranks: 0 is not better than 2.
- Nothing in the clustering was labelled. The groups come only from how close the rows are to each other. K-means clustering covers how.
Supervised vs unsupervised learning
| Supervised | Unsupervised | |
|---|---|---|
| Output column | Yes, the dependent feature | None |
| Problems | Regression (continuous), classification (categories) | Clustering, dimensionality reduction |
| Example from the video | Age to weight; study hours to pass or fail | Salary and age segments; 1000 to 100 features |
| scikit-learn call | fit(X, y) | fit(X) |
| Algorithms in this course | Linear and logistic regression, Naive Bayes, KNN, trees, ensembles, SVM | K-means, hierarchical clustering, DBSCAN, PCA |
Where you use supervised and unsupervised learning
- Predicting a number such as a house price or a delivery time: supervised regression.
- Predicting a category such as spam or not spam, pass or fail: supervised classification.
- Customer segmentation for targeted ads, as in the video: unsupervised clustering, often followed by a supervised model per segment.
Related
- Previous: AI vs ML vs DL vs data science
- Next: Instance-based vs model-based learning
- Reference: Supervised learning and Unsupervised learning in the scikit-learn user guide
- Change the new age from 23 to 30. The line slopes down in this tiny table, so the prediction drops.
- Set
n_clusters=2and see which two groups merge. - Add a seventh person,
[25, 92], topeopleand check that it joins the young high earners.
You understood something today that you didn't yesterday.