Confusion matrix
A confusion matrix is a table that counts a classifier's predictions against the true labels in four cells: true positives, false positives, false negatives and true negatives.
Last updated: 05 Oct, 2026 · scikit-learn 1.9.1
Log loss trains a classifier. To judge the yes or no answers it gives, count how many are right and wrong in each class, which is what performance metrics for classification start from.
At 2:01:16 the cell where actual and predicted are both 0 is called "false negative"; it is the true negative, as the board writes.
Counting the video's seven predictions
The data set has features x₁ and x₂, the actual output y and the model's predicted output ŷ:
- y, actual: 0 1 0 1 1 0 1
- ŷ, predicted: 1 1 0 1 1 1 0
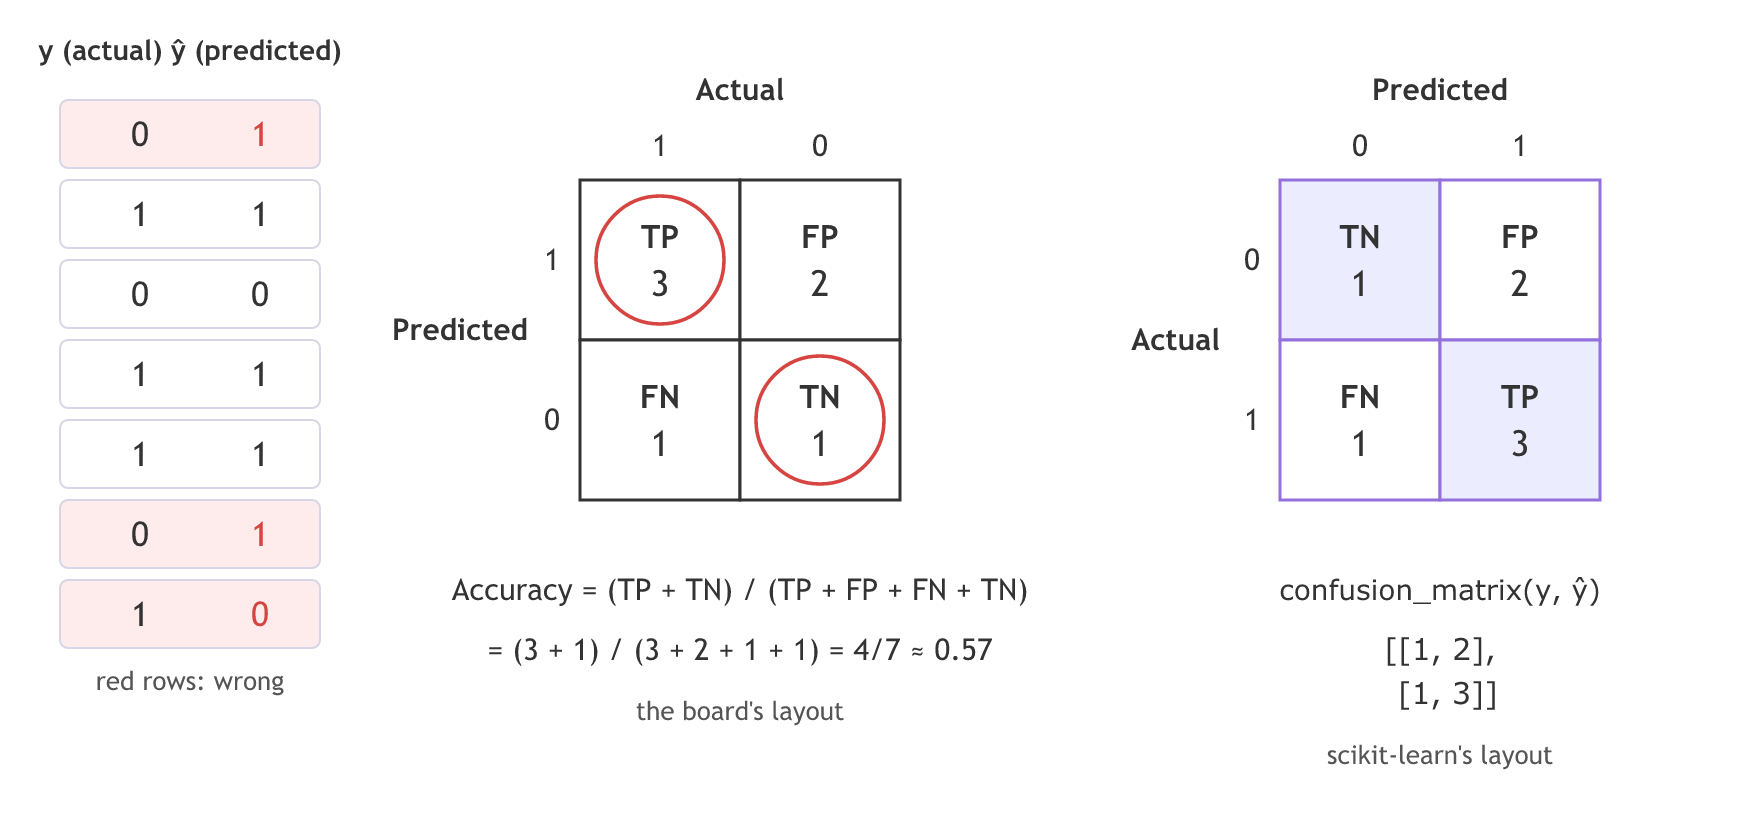
For a binary problem the confusion matrix is a 2 × 2 grid. Go through the rows one by one and add 1 to the matching cell: actual 0 and predicted 1 is a wrong prediction, actual 1 and predicted 1 a right one, and so on. The four cells have names:
- True positive (TP): actual 1, predicted 1. Here 3.
- True negative (TN): actual 0, predicted 0. Here 1.
- False positive (FP): actual 0, predicted 1. Here 2.
- False negative (FN): actual 1, predicted 0. Here 1.
Computing accuracy from the matrix
The diagonal cells, TP and TN, are the right answers. Accuracy is the right answers divided by all answers:
57% accuracy. The video ends the section with the aim of any classifier: reduce the false positives and the false negatives.
Building the matrix in code
confusion_matrix
scikit-learn puts the actual classes on the rows and the predicted classes on the columns, with class 0 first. The board draws predicted rows and actual columns with class 1 first, so the same counts sit in different places.
from sklearn.metrics import confusion_matrix

cm = confusion_matrix(y_true, y_pred)   # rows = actual, columns = predicted, class 0 first
tn, fp, fn, tp = cm.ravel()             # the four counts in that order
The four counts by hand and with scikit-learn
import numpy as np
from sklearn.metrics import confusion_matrix, accuracy_score

y = np.array([0, 1, 0, 1, 1, 0, 1])        # actual
y_hat = np.array([1, 1, 0, 1, 1, 1, 0])    # predicted

tp = int(np.sum((y == 1) & (y_hat == 1)))
tn = int(np.sum((y == 0) & (y_hat == 0)))
fp = int(np.sum((y == 0) & (y_hat == 1)))
fn = int(np.sum((y == 1) & (y_hat == 0)))
print("by hand: TP", tp, " TN", tn, " FP", fp, " FN", fn)
print("accuracy by hand:", round((tp + tn) / (tp + tn + fp + fn), 3))

cm = confusion_matrix(y, y_hat)
print(cm)
print("cm.ravel() -> tn, fp, fn, tp:", cm.ravel().tolist())
print("accuracy_score:", round(accuracy_score(y, y_hat), 3))by hand: TP 3 TN 1 FP 2 FN 1 accuracy by hand: 0.571 [[1 2] [1 3]] cm.ravel() -> tn, fp, fn, tp: [1, 2, 1, 3] accuracy_score: 0.571
Reading scikit-learn's layout
- The counts match the board. TP 3, TN 1, FP 2 and FN 1, and accuracy 0.571, the 4/7 = 57% of the video.
- Top row is actual 0. [1, 2]: one true negative and two false positives, the two students wrongly predicted 1.
- Bottom row is actual 1. [1, 3]: one false negative and three true positives.
- ravel reads the grid row by row. That is why the order is tn, fp, fn, tp, a handy line to unpack the four numbers.
Board layout vs scikit-learn layout
| The board | confusion_matrix | |
|---|---|---|
| Rows | predicted (1, then 0) | actual (0, then 1) |
| Columns | actual (1, then 0) | predicted (0, then 1) |
| Top-left cell | TP = 3 | TN = 1 |
| Bottom-right cell | TN = 1 | TP = 3 |
| Same counts? | yes | yes |
Where you use a confusion matrix
- After every classifier. It shows which mistake the model makes, which a single accuracy number hides.
- As the base of other metrics. Precision, recall and the F-score in Precision, recall and F-beta are ratios of these four cells.
- On the test set of a real model. The breast cancer model in Logistic regression in scikit-learn is judged first with confusion_matrix.
confusion_matrix(y_true, y_pred). Swap them and the grid is transposed, so FP and FN trade places. And accuracy alone can mislead on imbalanced data, the starting point of Precision, recall and F-beta.Related
- Previous: Log loss
- Next: Precision, recall and F-beta
- Reference: scikit-learn: Confusion matrix
- Run
confusion_matrix(y_hat, y)with the arguments swapped and find where the 2 false positives went. - Print
confusion_matrix(y, y_hat, labels=[1, 0]).T: it gives [[3, 2], [1, 1]], the board's layout. - Change the last predicted value from 0 to 1 and predict the new TP, FN and accuracy before you run it.
This is what real progress feels like.