 Statistics
Statistics is the science of collecting, organizing, analyzing and interpreting data, so that a decision can rest on evidence instead of a guess.
Last updated: 07 Oct, 2026
The opening example of the video is a classroom of maths students and their first-semester marks: 84, 86, 78, 72, 75, 65, 80, 81, 92, 95, 96 and 97. Two kinds of question can be asked about it. "What is the average mark in this class?" is answered from the 12 marks alone: their mean is 83.42. "Are the marks in this class similar to the marks of all the maths classrooms in the college?" is about students whose marks were never collected, so the answer has to be inferred from one class, with some uncertainty. The first question belongs to descriptive statistics and the second to inferential statistics, and the lessons teach both.
Defining statistics and data
The video starts from a short definition: statistics is the science of collecting, organizing and analyzing data, and the reason to do it is better decision making. A product team, a hospital or a government has more data than anyone can read, and statistics turns it into an answer it can act on. Fuller definitions add two more steps, interpreting the results and presenting them, and much of statistics is about saying how sure an answer is.
Data are facts or pieces of information recorded about something. The video's examples are the IQ scores of a class and the ages of the students in a class, such as 30, 25, 24, 23, 27 and 28. Data can be numbers, like these ages, or categories, like a blood group or a city, and the difference decides which methods apply, as Types of variables shows.
- Descriptive statistics organizes and summarizes the data you have: tables, charts and numbers such as the mean.
- Inferential statistics uses a sample to draw conclusions about the larger population it came from, and measures how uncertain those conclusions are. Descriptive and inferential statistics compares the two.
Following the learning path
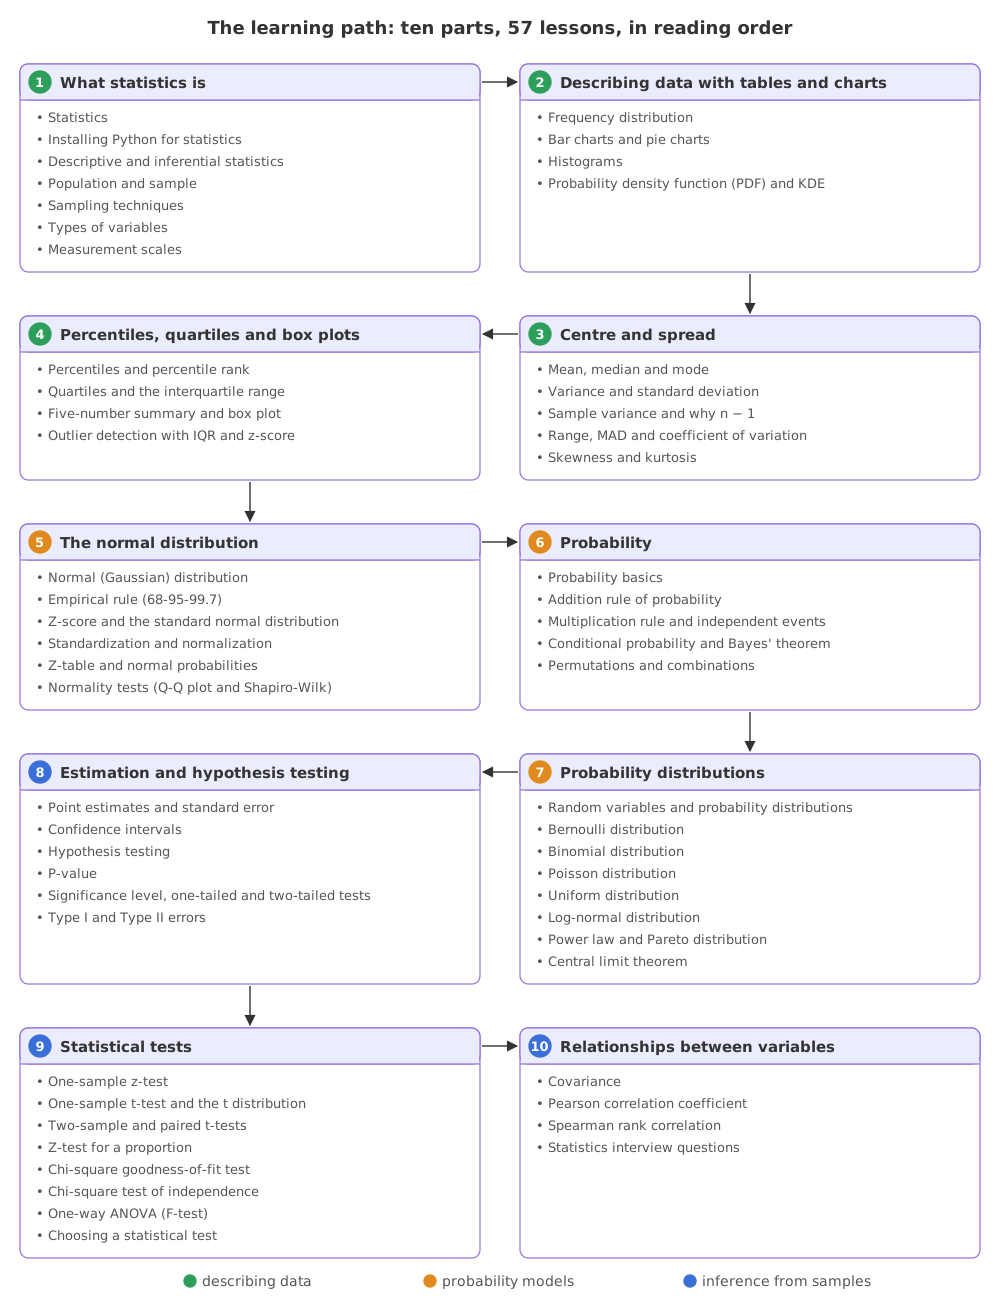
The parts follow the video's order with one change: the probability distributions come before estimation, because confidence intervals and tests are built on the normal distribution, the t distribution and the central limit theorem. Parts 1 to 4 describe data. Parts 5 to 7 are the probability models that describe how data varies by chance. Parts 8 to 10 use those models to reach conclusions from samples. The table lists every lesson, part by part.
| Part | Lessons | Starts with |
|---|---|---|
| 1. What statistics is | Installing Python for statistics · Descriptive and inferential statistics · Population and sample · Sampling techniques · Types of variables · Measurement scales | Installing Python for statistics |
| 2. Describing data with tables and charts | Frequency distribution · Bar charts and pie charts · Histograms · Probability density function (PDF) and KDE | Frequency distribution |
| 3. Centre and spread | Mean, median and mode · Variance and standard deviation · Sample variance and why n − 1 · Range, MAD and coefficient of variation · Skewness and kurtosis | Mean, median and mode |
| 4. Percentiles, quartiles and box plots | Percentiles and percentile rank · Quartiles and the interquartile range · Five-number summary and box plot · Outlier detection with IQR and z-score | Percentiles and percentile rank |
| 5. The normal distribution | Normal (Gaussian) distribution · Empirical rule (68-95-99.7) · Z-score and the standard normal distribution · Standardization and normalization · Z-table and normal probabilities · Normality tests (Q-Q plot and Shapiro-Wilk) | Normal (Gaussian) distribution |
| 6. Probability | Probability basics · Addition rule of probability · Multiplication rule and independent events · Conditional probability and Bayes' theorem · Permutations and combinations | Probability basics |
| 7. Probability distributions | Random variables and probability distributions · Bernoulli distribution · Binomial distribution · Poisson distribution · Uniform distribution · Log-normal distribution · Power law and Pareto distribution · Central limit theorem | Random variables and probability distributions |
| 8. Estimation and hypothesis testing | Point estimates and standard error · Confidence intervals · Hypothesis testing · P-value · Significance level, one-tailed and two-tailed tests · Type I and Type II errors | Point estimates and standard error |
| 9. Statistical tests | One-sample z-test · One-sample t-test and the t distribution · Two-sample and paired t-tests · Z-test for a proportion · Chi-square goodness-of-fit test · Chi-square test of independence · One-way ANOVA (F-test) · Choosing a statistical test | One-sample z-test |
| 10. Relationships between variables | Covariance · Pearson correlation coefficient · Spearman rank correlation · Statistics interview questions | Covariance |
Who this course is for
- Beginners in data science, data analysis and business intelligence. The video is aimed at these roles, and every method is shown on small numbers you can check by hand before Python does it.
- Interview preparation. The video poses the questions interviewers ask, such as "what is the difference between ordinal and nominal data?" and "what is the difference between a bar chart and a histogram?", and the lessons answer them.
- Machine learning learners. Scaling, train and test splits, model metrics and A/B tests all rest on these ideas; the Machine Learning course builds on them.
Preparing what you need
- Python basics: variables, lists, loops, functions and importing a library.
- School maths: averages, fractions, percentages, squares and square roots. Every formula is worked out on the video's numbers before it is used.
- Python 3.12 or newer on Windows, macOS or Linux, or Google Colab in a browser. Installing Python for statistics sets up both.
- No API keys and no GPU. The data is typed into the code or loads from seaborn over the internet.
Reading a lesson
Each lesson opens with a one-sentence definition and a clip from the video where the video teaches the idea. The text under a clip follows it, with the video's example and numbers, then turns the idea into a formula and works it out. Lessons with something to compute end in Python code whose printed output comes from a real run, and every lesson closes with a few changes to try.
Following the video and its notes
The lessons follow Complete Statistics For Data Science In 6 hours (2022, 5 hours 28 minutes), edited from a seven-day live series held in January 2022. The theory is written on a digital board, and the practical parts run in Jupyter notebooks.
The video's description links its materials, which serve as the notes for this course: the Complete Statistics folder of The Grand Complete Data Science Materials on GitHub. It holds five PDFs of handwritten board notes, a PDF of statistics interview questions with answers, the Stats_Practicals notebook (finding outliers with z-scores and the IQR) and a hypothesis-testing notebook (chi-square tests, t-tests and correlation) with its saved outputs. The notes and standard statistics add topics the video does not teach, such as Sample variance and why n − 1, Conditional probability and Bayes' theorem, Two-sample and paired t-tests, One-way ANOVA (F-test) and Choosing a statistical test.
The Python libraries have changed since 2022. These are the behaviours the lessons point out where they matter:
| The video (2022) | Today (NumPy 2.5, pandas 3.0, SciPy 1.18, seaborn 0.13) |
|---|---|
sns.boxplot(data) with the data passed by position | Pass it by name, sns.boxplot(x=data), to get a horizontal box of one variable |
df.corr() on a table with text columns | Raises an error unless you pass numeric_only=True |
chi2_contingency(table) on a 2 × 2 table | Applies Yates' continuity correction by default (correction=True) |
np.var and np.std next to pandas | NumPy divides by n (ddof=0); pandas .var() and .std() divide by n − 1 (ddof=1) |
np.random.choice(data, n) for a random sample | Samples with replacement unless you pass replace=False |
| Percentiles by hand | np.percentile uses linear interpolation by default, which can differ from a hand method on small data |
Related
Every expert started right here.