
Two-sample and paired t-tests
A two-sample t-test is a hypothesis test that compares the means of two independent groups; a paired t-test compares two measurements on the same subjects by testing whether their mean difference is zero.
Last updated: 07 Oct, 2026 · SciPy 1.18
The One-sample t-test and the t distribution compared one sample with a fixed number. Most real questions compare two groups: two classes, two web page designs, the same patients before and after a drug. The video's notebook runs both versions on ages and weights.
Telling independent samples from paired samples
Two samples are independent when different subjects are in each group and knowing a value in one group says nothing about any value in the other. They are paired when each value in one sample belongs with one value in the other: the same person weighed twice, the left and right eye of one patient, two scores for one student.
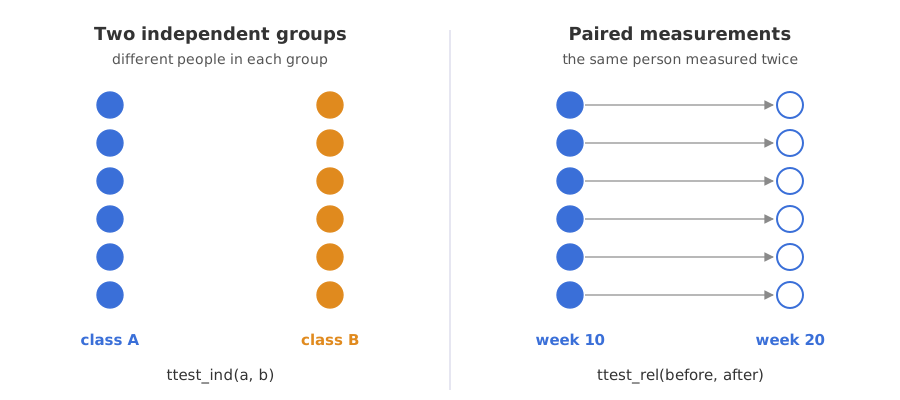
Comparing two independent means
The hypotheses for two groups A and B are H₀: μ_A = μ_B and H₁: μ_A ≠ μ_B. The statistic divides the gap between the sample means by its standard error. Two versions differ in how they estimate that standard error.
The pooled two-sample t-test
If both populations have the same variance, the two sample variances are averaged into one pooled variance s_p², weighted by their degrees of freedom. The test then has n₁ + n₂ − 2 degrees of freedom.
Welch's t-test
Welch's test drops the equal-variance assumption. Each group keeps its own variance, and the degrees of freedom come from the Welch-Satterthwaite formula, usually a non-integer. It is the safer default, since it loses almost nothing when the variances are equal.
Running Welch and pooled tests on the class ages
The notebook makes class B the same way as class A, with Poisson counts on top of 18, and asks whether the two classes have the same mean age.
The two classes
import numpy as np
from scipy import stats

np.random.seed(6)
school_ages = stats.poisson.rvs(loc=18, mu=35, size=1500)
classA_ages = stats.poisson.rvs(loc=18, mu=30, size=60)
np.random.seed(12)
ClassB_ages = stats.poisson.rvs(loc=18, mu=33, size=60)
The two versions of ttest_ind
welch = stats.ttest_ind(a=classA_ages, b=ClassB_ages, equal_var=False)
pooled = stats.ttest_ind(a=classA_ages, b=ClassB_ages) # equal_var=True is the defaultprint("means:", classA_ages.mean(), round(ClassB_ages.mean(), 4))
print("SDs: ", round(classA_ages.std(ddof=1), 3), round(ClassB_ages.std(ddof=1), 3))
for name, r in (("Welch ", welch), ("pooled", pooled)):
print(f"{name}: t = {r.statistic:.4f}, df = {r.df:.1f}, p = {r.pvalue:.6f}")means: 46.9 50.6333 SDs: 5.164 6.017 Welch : t = -3.6471, df = 115.3, p = 0.000399 pooled: t = -3.6471, df = 118.0, p = 0.000396
- Class A averages 46.9 and class B 50.63. Their sample SDs are 5.16 and 6.02.
- Welch gives t = −3.647 with 115.3 df and p = 0.000399. If the two classes had the same mean age, a gap of 3.7 years or more between samples of 60 would happen about 4 times in 10,000. We reject H₀: the mean ages differ.
- The pooled test gives the same t and df = 118. With equal group sizes the two t statistics are always equal; only the degrees of freedom, and so the p-value (0.000396), move a little.
When pooled and Welch disagree
The two versions part ways when the groups differ in both size and spread. A small tight group against a large spread-out group shows it:
import numpy as np
from scipy import stats

rng = np.random.default_rng(42)
small_tight = rng.normal(loc=50, scale=2, size=10)    # 10 values, SD about 2
large_wide = rng.normal(loc=48, scale=10, size=40)    # 40 values, SD about 10
for equal_var in (True, False):
    r = stats.ttest_ind(small_tight, large_wide, equal_var=equal_var)
print(f"equal_var={equal_var!s:5}: t = {r.statistic:.3f}, df = {r.df:.1f}, p = {r.pvalue:.4f}")equal_var=True : t = -0.291, df = 48.0, p = 0.7720 equal_var=False: t = -0.522, df = 47.6, p = 0.6044
Pooled gives t = −0.291 and p = 0.772; Welch gives t = −0.522 and p = 0.604. Neither rejects H₀ here, but the two tests disagree on the size of the evidence. The pooled test takes most of its variance from the large, wide group and applies it to the small one, so its standard error is wrong for this pair of groups. Welch's p-value is the one to trust here.
Testing paired measurements
The notebook's paired example weighs 15 people at week 10 and again at week 20. Pairing removes the person-to-person differences: the test works on each person's change, d = after − before, and is a one-sample t-test of H₀: mean change = 0 with n − 1 = 14 degrees of freedom.
The second weights are the values the notebook drew, rounded to two decimals.
import numpy as np
from scipy import stats

weight1 = [25, 30, 28, 35, 28, 34, 26, 29, 30, 26, 28, 32, 31, 30, 45]   # week 10
weight2 = [30.58, 34.91, 29.00, 30.54, 19.86, 37.58, 18.33, 21.38,
36.36, 32.06, 26.94, 29.52, 26.43, 30.51, 41.33] # week 20diff = np.array(weight2) - np.array(weight1)
print("mean change:", round(diff.mean(), 3), " SD of the changes:", round(diff.std(ddof=1), 3))
r = stats.ttest_rel(a=weight1, b=weight2)
print(f"ttest_rel: t = {r.statistic:.4f}, p = {r.pvalue:.4f}, df = {r.df}")
r1 = stats.ttest_1samp(weight1 - np.array(weight2), 0)
print(f"ttest_1samp on diffs: t = {r1.statistic:.4f}, p = {r1.pvalue:.4f}")
r2 = stats.ttest_ind(weight1, weight2)
print(f"ttest_ind (ignores the pairs): p = {r2.pvalue:.4f}")mean change: -0.778 SD of the changes: 5.224 ttest_rel: t = 0.5768, p = 0.5732, df = 14 ttest_1samp on diffs: t = 0.5768, p = 0.5732 ttest_ind (ignores the pairs): p = 0.7142
What the paired run shows
- The mean change is −0.778 kg with a standard deviation of 5.224 kg across people.
- ttest_rel gives p = 0.5732. If the true mean change were 0, a sample mean change at least this far from 0 would happen in about 57% of samples. We fail to reject H₀: no evidence of a change in weight.
- ttest_rel and ttest_1samp on the differences print the same t and p, because a paired test is a one-sample test on the differences.
ttest_rel(a, b)works on a − b, here week 10 minus week 20, so its t is positive while the mean change after − before is negative; flipping the order flips the sign of t and leaves p unchanged. - ttest_ind on the same numbers gives p = 0.7142. Treating the pairs as two unrelated groups uses the wrong standard error and wastes the pairing.
Two-sample t-test vs paired t-test
| Two-sample (independent) | Paired | |
|---|---|---|
| Subjects | Different in each group | The same subjects measured twice, or matched pairs |
| H₀ | μ_A = μ_B | mean difference = 0 |
| Degrees of freedom | n₁ + n₂ − 2 (pooled) or the Welch formula | n − 1 pairs |
| SciPy | ttest_ind(a, b, equal_var=False) | ttest_rel(a, b) |
| Rank-based alternative | Mann-Whitney U (mannwhitneyu) | Wilcoxon signed-rank (wilcoxon) |
Where you use two-sample and paired t-tests
- A/B tests: mean time on page for users who saw the old design against users who saw the new one (independent).
- Before and after: blood pressure, weight or a test score for the same people before and after a treatment (paired).
- Comparing two machines or suppliers: mean fill volume or defect size from two production lines (independent).
ttest_ind runs the pooled test unless you pass equal_var=False. With unequal group sizes and spreads the pooled p-value can be far off, so ask for Welch's test by name. And never use ttest_ind on paired data: pair the values and use ttest_rel.Related
- Previous: One-sample t-test and the t distribution
- Next: Z-test for a proportion
- See also: Choosing a statistical test
- Reference: scipy.stats.ttest_ind
- In the class example, change class B's
mu=33tomu=30, the same as class A. Does Welch's test still reject H₀? - In the unequal-groups example change
scale=10toscale=2. Do the two p-values come together? - Run
stats.ttest_rel(weight1, weight2, alternative="greater"). Which direction does this H₁ test?
You understood something today that you didn't yesterday.