
One-way ANOVA (F-test)
One-way ANOVA (analysis of variance) is a hypothesis test that checks whether three or more groups have the same population mean, by comparing the variation between the group means with the variation inside the groups.
Last updated: 07 Oct, 2026 · SciPy 1.18
A t-test compares two groups. With three groups you could run three t-tests, but each one carries its own 5% chance of a false alarm, so the chance of at least one goes up. ANOVA asks one question about all the groups at once: the F-test. The video lists it on the session's agenda; its notebook runs it on the iris flowers.
Stating the ANOVA hypotheses
The notebook's example: iris flowers come in 3 species, setosa, versicolor and virginica, 50 flowers each. Do the three species have the same mean petal width?
- H₀: μ_setosa = μ_versicolor = μ_virginica, all the group means are equal.
- H₁: at least one group mean is different. ANOVA does not say which one.
Splitting the variation between and within groups
ANOVA splits the spread of all the values around the grand mean into two parts:
- Between groups (SSB): how far each group mean is from the grand mean, weighted by group size. Large when the groups differ.
- Within groups (SSW): how far each value is from its own group's mean. This is the noise inside the groups.
Each sum of squares is divided by its degrees of freedom to make a mean square: k − 1 between the k groups, N − k within the N values. The F statistic is their ratio. If H₀ is true both mean squares estimate the same noise variance and F is near 1; a large F means the group means are further apart than the noise explains.
Like χ², F is right-tailed: only a large F counts against H₀. The F distribution has two degrees of freedom, here 2 and 147.
Running ANOVA on the iris petal widths
Splitting petal width by species
import numpy as np
import pandas as pd
import seaborn as sns
from scipy import stats

df1 = sns.load_dataset("iris")
df_anova = df1[["petal_width", "species"]]
grps = pd.unique(df_anova.species.values)
d_data = {grp: df_anova["petal_width"][df_anova.species == grp] for grp in grps}
The F-test with f_oneway
F, p = stats.f_oneway(d_data["setosa"], d_data["versicolor"], d_data["virginica"])print(df_anova.groupby("species")["petal_width"].agg(["count", "mean", "std"]).round(3))
print("F =", round(F, 2), " p =", p)
print("reject H0" if p <= 0.05 else "fail to reject H0")count mean std species setosa 50 0.246 0.105 versicolor 50 1.326 0.198 virginica 50 2.026 0.275 F = 960.01 p = 4.169445839443833e-85 reject H0
The F statistic by hand
groups = list(d_data.values())
grand_mean = df_anova["petal_width"].mean()
k, N = len(groups), len(df_anova)
ssb = sum(len(g) * (g.mean() - grand_mean) ** 2 for g in groups)   # between groups
ssw = sum(((g - g.mean()) ** 2).sum() for g in groups)               # within groups
msb, msw = ssb / (k - 1), ssw / (N - k)
F_hand = msb / msw
print(f"SSB = {ssb:.4f}, SSW = {ssw:.4f}")
print(f"MSB = {msb:.4f} (df {k - 1}), MSW = {msw:.4f} (df {N - k})")
print(f"F = {F_hand:.2f}, critical F(0.95; 2, 147) = {stats.f.ppf(0.95, k - 1, N - k):.3f}")SSB = 80.4133, SSW = 6.1566 MSB = 40.2067 (df 2), MSW = 0.0419 (df 147) F = 960.01, critical F(0.95; 2, 147) = 3.058
import seaborn as sns
import matplotlib.pyplot as plt

iris = sns.load_dataset("iris")
plt.figure(figsize=(7, 4))
sns.boxplot(data=iris, x="species", y="petal_width", color="white")
sns.stripplot(data=iris, x="species", y="petal_width", color="tab:blue", alpha=0.5, jitter=0.2)
plt.axhline(iris["petal_width"].mean(), color="red", linestyle="--", label="grand mean 1.199")
plt.title("Petal width by species: big gaps between groups, little spread inside each")
plt.xlabel("species")
plt.ylabel("petal width (cm)")
plt.legend()
plt.show()
print(iris.groupby("species")["petal_width"].mean().round(3).to_dict()){'setosa': 0.246, 'versicolor': 1.326, 'virginica': 2.026}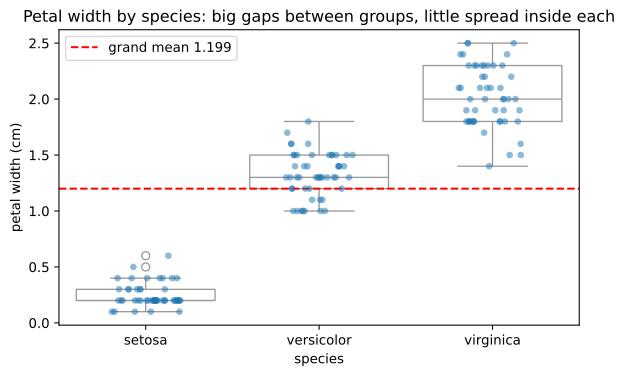
What the F-test found
- The species means are 0.246, 1.326 and 2.026 cm, with standard deviations of only 0.105, 0.198 and 0.275.
- F = 960.01 with 2 and 147 degrees of freedom, p = 4.17 × 10⁻⁸⁵. The critical F at α = 0.05 is 3.058. If the three species had the same mean petal width, groups this far apart would essentially never be sampled. We reject H₀.
- The hand calculation gives the same F: SSB is about 80.4 and SSW about 6.2, so almost all the variation lies between the species.
Finding which groups differ
Rejecting H₀ says at least one mean differs. A post-hoc test compares every pair while keeping the overall false-alarm rate at 5%. Tukey's HSD is the usual one after ANOVA. ANOVA also assumes independent groups, roughly normal values and equal variances; Welch's ANOVA drops the equal-variance assumption, and the rank-based Kruskal-Wallis test drops normality.
tukey = stats.tukey_hsd(d_data["setosa"], d_data["versicolor"], d_data["virginica"])
names = list(d_data)
for i, j in [(0, 1), (0, 2), (1, 2)]:
    lo, hi = tukey.confidence_interval().low[i, j], tukey.confidence_interval().high[i, j]
    print(f"{names[i]:10} - {names[j]:10}: diff = {tukey.statistic[i, j]:6.3f}, "
          f"95% CI [{lo:.3f}, {hi:.3f}], p = {tukey.pvalue[i, j]:.2g}")
welch = stats.f_oneway(*d_data.values(), equal_var=False)
print(f"Welch ANOVA: F = {welch.statistic:.1f}, p = {welch.pvalue:.3g}")
print(f"Kruskal-Wallis: H = {stats.kruskal(*d_data.values()).statistic:.2f}")setosa - versicolor: diff = -1.080, 95% CI [-1.177, -0.983], p = 2.1e-14 setosa - virginica : diff = -1.780, 95% CI [-1.877, -1.683], p = 2.1e-14 versicolor - virginica : diff = -0.700, 95% CI [-0.797, -0.603], p = 2.1e-14 Welch ANOVA: F = 1276.9, p = 4.14e-64 Kruskal-Wallis: H = 131.19
All three pairs differ, with confidence intervals far from 0: virginica's petals are 0.70 cm wider than versicolor's and 1.78 cm wider than setosa's. Welch's ANOVA and Kruskal-Wallis reject H₀ as well.
ANOVA vs t-test
| Two-sample t-test | One-way ANOVA | |
|---|---|---|
| Groups | 2 | 2 or more |
| Statistic | t, the gap in units of its standard error | F = MSB / MSW |
| Tails | One or two | Right-tailed only |
| Says which group differs | Yes, there is only one pair | No, needs a post-hoc test such as Tukey's HSD |
| SciPy | ttest_ind | f_oneway, tukey_hsd |
With two groups the two tests agree: F equals t² from the pooled t-test.
Where you use one-way ANOVA
- Comparing treatments: the Q&A notes' farmer testing three fertilizers on crop yield.
- Comparing versions: mean order value across three or more website designs or pricing pages.
- Feature screening: whether a numeric feature's mean differs across the classes of a categorical target (scikit-learn's
f_classifcomputes this F for every feature).
f_oneway(..., equal_var=False).Related
- Previous: Chi-square test of independence
- Next: Choosing a statistical test
- See also: Two-sample and paired t-tests
- Reference: scipy.stats.f_oneway
- Run the same test on
sepal_widthinstead ofpetal_width. Is F still in the hundreds? - Run
stats.f_oneway(d_data["versicolor"], d_data["virginica"])and compare F with the square of the pooled t fromstats.ttest_indon the same two groups. - Add 0.5 to every setosa value and run the F-test again. Which part, SSB or SSW, changes?
Little by little, you're building something great.