
Mean, median and mode
Mean, median and mode are measures of central tendency that describe the centre of a dataset with one number: the average, the middle value and the most frequent value.
Last updated: 07 Oct, 2026 · SciPy 1.18
A histogram or a density curve shows the whole shape of the data (Probability density function (PDF) and KDE). Often one number for the centre is what you need: what a typical value is. The three measures give different answers on the same data, and an outlier is what tells them apart.
Calculating the population mean and the sample mean
The mean is the average: add the values and divide by how many there are. Statistics writes it two ways, because a population of size N and a sample of size n get different symbols (Population and sample).
The board's dataset has ten values, X = {1, 1, 2, 2, 3, 3, 4, 5, 5, 6}. Their sum is 32, so μ = 32/10 = 3.2. Treated as a sample, the arithmetic is the same and x̄ = 3.2. The two formulas differ in notation, not in the result: μ is a parameter of the whole population, x̄ is a statistic computed from the sample you have. Using the standard symbols matters when you explain your work to other data scientists.
A measure of central tendency is a measure used to determine the centre of the distribution of data. The mean, the median and the mode are the three main ones. "Average" in everyday speech means this arithmetic mean; weighted, geometric and harmonic means are other kinds of mean.
Adding an outlier to the mean
Add one value that is far from the rest, 100, to the same ten values. The sum becomes 32 + 100 = 132 and the count 11, so the mean is 132/11 = 12. One value moved the mean from 3.2 to 12, which is larger than ten of the eleven values. A value that is very different from the rest of the distribution is an outlier. The mean follows it because every value enters the sum, which is why outliers need care in statistics and data science.
Finding the median by sorting
The median is the middle value of the sorted data. The first step is always to sort the numbers. With an odd count, take the middle value; with an even count, take the average of the two middle values.
- 11 values, {1, 1, 2, 2, 3, 3, 4, 5, 5, 6, 100}: the middle one is the 6th, so the median is 3.
- 12 values, with a second outlier 112: the two middle values are the 6th and the 7th, 3 and 4, so the median is (3 + 4)/2 = 3.5.
The mean went from 3.2 to 12 with one outlier. The median went from 3 to 3 with one outlier and to 3.5 with two. The median works well with outliers: it depends only on the order of the values, so an extreme value counts as one more value at the end of the list. It moves far only when outliers make up a large share of the data, close to half of it.
Finding the mode as the most frequent value
The mode is the value that occurs most often. In {1, 2, 2, 3, 4, 5, 6, 6, 6, 7, 8, 100, 200}, 6 appears three times and 2 appears twice, so the mode is 6. The outliers 100 and 200 do not change it, because the mode looks only at counts. That is also its weak point: if an extreme value were the most frequent one, for example 100 repeated many times, the mode would be that extreme value. For a typical value of numeric data with outliers, the median is the usual choice.
Data can have more than one mode. In {1, 2, 2, 3, 3, 4, 4, 5, 6} the values 2, 3 and 4 each appear twice, so all three are modes.
Filling missing values with the mean, median or mode
The mode works for numbers and for categories, and it works best for categories. A flower dataset has a type of flower column (rose, lily, sunflower) next to petal length and petal width, and 10% of its values are missing. A flower type has no mean or median, so each missing type is filled with the most frequent type, the mode. For nominal data the mode is the only one of the three measures that exists (Measurement scales).
A column of student ages, 25, 26, three missing, 32, 34 and 38, sits in a narrow range with no outliers, so the mean is a sound value to fill in. For the ages of the whole world population the mean would be a poor choice. Domain knowledge decides. A common rule of thumb:
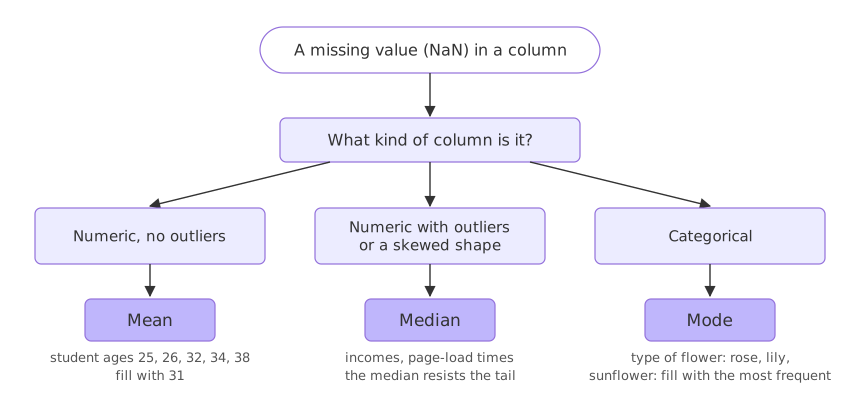
- Numeric, no outliers: fill with the mean.
- Numeric with outliers or a skewed shape: fill with the median.
- Categorical: fill with the mode.
Computing the mean, median and mode in Python
The mean and the median with NumPy
np.mean adds the values and divides by the count. np.median sorts them and takes the middle, averaging the two middle values when the count is even.
import numpy as np

data = [1, 1, 2, 2, 3, 3, 4, 5, 5, 6, 100]
np.mean(data)      # sum / count
np.median(data)    # middle value of the sorted data
The mode with the statistics module and pandas
statistics.mode returns one mode, the first one it meets in the data. statistics.multimode and pandas' Series.mode() return every mode.
import statistics
import pandas as pd

statistics.mode(data)          # one mode
statistics.multimode(data)     # a list of all the modes
pd.Series(data).mode()         # all the modes, sorted
Filling missing values with fillna
pandas marks a missing value as NaN (or None in a text column). fillna replaces each one with the value you pass. mode() returns a Series, so [0] takes its first mode.
col.fillna(col.mean())       # numeric, no outliers
col.fillna(col.median())     # numeric with outliers
col.fillna(col.mode()[0])    # categorical
Moving the mean and the median with outliers
import numpy as np
import matplotlib.pyplot as plt

base = [1, 1, 2, 2, 3, 3, 4, 5, 5, 6]
datasets = {"the 10 values": base,
            "with 100": base + [100],
            "with 100 and 112": base + [100, 112]}

for name, data in datasets.items():
    print(f"{name:17} n={len(data):2}  mean={np.mean(data):6.2f}  median={np.median(data)}")

fig, ax = plt.subplots(figsize=(8, 3))
for row, (name, data) in enumerate(datasets.items()):
    ax.scatter(data, [row] * len(data), color="grey", s=30)
    ax.scatter(np.mean(data), row, color="red", marker="|", s=900, label="mean" if row == 0 else None)
    ax.scatter(np.median(data), row, color="blue", marker="|", s=900, label="median" if row == 0 else None)
ax.set_yticks(range(3), list(datasets))
ax.set_ylim(-0.6, 2.6)
ax.set_xlabel("value")
ax.set_title("Outliers move the mean, not the median")
ax.legend(loc="lower center", markerscale=0.4)
plt.show()the 10 values n=10 mean= 3.20 median=3.0 with 100 n=11 mean= 12.00 median=3.0 with 100 and 112 n=12 mean= 20.33 median=3.5
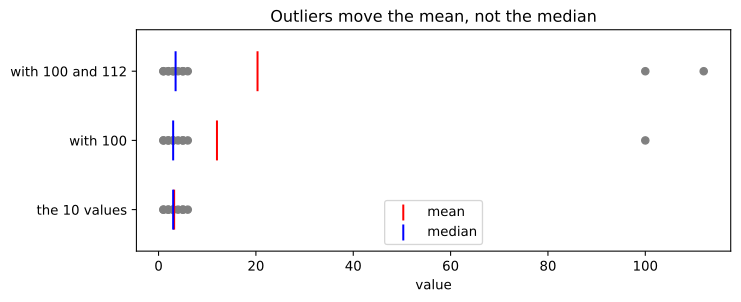
What the three datasets show
- The ten values have a mean of 3.20 and a median of 3.0, close together because the data has no outlier.
- With 100 the mean jumps to 12.00 while the median stays at 3.0.
- With 100 and 112 the mean is 20.33, larger than every value except the two outliers. The median moves only to 3.5, the average of the two middle values 3 and 4.
Finding modes and filling missing values
import statistics
import pandas as pd

mode_data = [1, 2, 2, 3, 4, 5, 6, 6, 6, 7, 8, 100, 200]
print("mode:", statistics.mode(mode_data))

three_modes = [1, 2, 2, 3, 3, 4, 4, 5, 6]          # 2, 3 and 4 each appear twice
print("statistics.mode:     ", statistics.mode(three_modes))
print("statistics.multimode:", statistics.multimode(three_modes))
print("pandas mode():       ", pd.Series(three_modes).mode().tolist())

flowers = pd.Series(["Rose", "Lily", "Rose", "Sunflower", None, "Rose", None, "Lily"])
print("flowers filled:", flowers.fillna(flowers.mode()[0]).tolist())

ages = pd.Series([25, 26, None, None, None, 32, 34, 38])
print("mean age:", ages.mean(), " median age:", ages.median())
print("ages filled:", ages.fillna(ages.mean()).tolist())mode: 6 statistics.mode: 2 statistics.multimode: [2, 3, 4] pandas mode(): [2, 3, 4] flowers filled: ['Rose', 'Lily', 'Rose', 'Sunflower', 'Rose', 'Rose', 'Rose', 'Lily'] mean age: 31.0 median age: 32.0 ages filled: [25.0, 26.0, 31.0, 31.0, 31.0, 32.0, 34.0, 38.0]
What the modes and the filled columns show
- The mode of the board's data is 6, the value that appears three times.
- With three modes,
statistics.modereturns only 2, the first mode in the list, whilemultimodeand pandas return all three: [2, 3, 4]. - The flower column has Rose three times, so both missing types become Rose.
- The ages 25, 26, 32, 34 and 38 have a mean of 31.0 and a median of 32.0. Filling with the mean puts 31.0 into the three gaps.
Mean vs median vs mode
| Mean | Median | Mode | |
|---|---|---|---|
| What it is | sum ÷ count | middle value of the sorted data | most frequent value |
| Uses | every value | the order of the values | the counts of each value |
| One outlier | pulls it towards the outlier | barely moves it | does not change it |
| Data types | numeric (interval, ratio) | numeric or ordinal | any, including categories |
| Missing values | numeric column, no outliers | numeric column with outliers or skew | categorical column |
Where you use the mean, median and mode
- Reporting a typical value: the median house price or salary, because a few very large values would inflate the mean.
- Filling missing values before training a model: the mean, median or mode of the column, chosen by its type and shape.
- Totals and budgets: the mean, because mean × count gives back the total, which the median does not.
statistics.mode returns a single value even when the data has several modes, and it gives no warning. Use statistics.multimode or Series.mode() to see all of them before you fill a column with one.Related
- Previous: Probability density function (PDF) and KDE
- Next: Variance and standard deviation
- See also: Skewness and kurtosis
- Add a third outlier, 120, to the 12 values in the first example and predict the median before you run it.
- Change the flower column so that Lily appears three times as well, and see which flower
mode()[0]picks. - Fill the ages with
ages.median()instead of the mean and compare the two filled columns.
Little by little, you're building something great.