
Quartiles and the interquartile range
Quartiles are the three values that split sorted data into four equal parts: Q1 (the 25th percentile), the median and Q3 (the 75th percentile), and the interquartile range (IQR = Q3 − Q1) is the spread of the middle half of the data.
Last updated: 07 Oct, 2026 · SciPy 1.18
Percentiles and percentile rank found the value at any percentile with the (n + 1)p position. Quartiles are three of those percentiles, and the distance between two of them gives a measure of spread that one outlier cannot inflate. The same two numbers set the fences that flag outliers.
Setting a lower fence and an upper fence
The board's dataset has 19 values, and one of them looks out of place:
1, 2, 2, 2, 3, 3, 4, 5, 5, 5, 6, 6, 6, 6, 7, 8, 8, 9, 27
To decide which values are outliers, the data gets a lower fence and an upper fence. Values above the upper fence or below the lower fence are treated as outliers. A value of −50 in this data would be one too, on the low side. The fences are built from the quartiles and the IQR:
Finding Q1 and Q3 with the (n + 1)p position
Q1 is the 25th percentile and Q3 the 75th. With n = 19 the positions are 25/100 × (19 + 1) = 5 and 75/100 × 20 = 15, both whole numbers, so no interpolation is needed. The 5th sorted value is 3, so Q1 = 3. The 15th is 7, so Q3 = 7. The interquartile range is IQR = 7 − 3 = 4.
Computing the fences for the 19 values
- Lower fence = 3 − 1.5 × 4 = 3 − 6 = −3.
- Upper fence = 7 + 1.5 × 4 = 7 + 6 = 13.
Anything greater than 13 or less than −3 is treated as an outlier. Only 27 is outside the range from −3 to 13, so 27 is flagged. The 1.5 × IQR rule is Tukey's convention for flagging candidates: whether a flagged value is a mistake or a real extreme value is a separate question (Outlier detection with IQR and z-score).
Comparing quantile methods
The board's quartiles use the (n + 1)p position. NumPy, pandas, matplotlib and seaborn use the 'linear' method by default, and on these 19 values it gives a different Q3:
| Method | Where you meet it | Q1 | Q3 | IQR | Fences |
|---|---|---|---|---|---|
(n + 1)p, 'weibull' | the board, Excel PERCENTILE.EXC | 3 | 7 | 4 | −3, 13 |
| Tukey's hinges | medians of the lower and upper half | 3 | 7 | 4 | −3, 13 |
'linear' | NumPy, pandas default, Excel PERCENTILE.INC | 3 | 6.5 | 3.5 | −2.25, 11.75 |
'hazen' | (n p + 0.5) position | 3 | 6.75 | 3.75 | −2.625, 12.375 |
Every method flags 27 as the only outlier, so the outlier verdict does not change. The quartiles themselves do, which matters when you compare a hand calculation with software, or one library with another.
Computing quartiles in Python
np.percentile with an explicit method
import numpy as np

q1, q3 = np.percentile(data, [25, 75], method="weibull")   # the (n + 1)p method
iqr = q3 - q1
lower_fence, upper_fence = q1 - 1.5 * iqr, q3 + 1.5 * iqr
pandas quantile and scipy.stats.iqr
Both use the linear method by default. scipy.stats.iqr takes the same method names through its interpolation argument.
import pandas as pd
from scipy import stats

pd.Series(data).quantile([0.25, 0.75])    # Q1 and Q3, linear method
stats.iqr(data)                           # Q3 - Q1, linear method
Flagging 27 with the fences
import numpy as np
import matplotlib.pyplot as plt

data = [1, 2, 2, 2, 3, 3, 4, 5, 5, 5, 6, 6, 6, 6, 7, 8, 8, 9, 27]
q1, q3 = np.percentile(data, [25, 75], method="weibull")    # the (n + 1)p method
iqr = q3 - q1
lower_fence, upper_fence = q1 - 1.5 * iqr, q3 + 1.5 * iqr
print("Q1:", q1, " Q3:", q3, " IQR:", iqr)
print("fences:", lower_fence, upper_fence)
print("outside the fences:", [x for x in data if x < lower_fence or x > upper_fence])

fig, ax = plt.subplots(figsize=(9, 2.6))
seen = {}
for v in data:
    seen[v] = seen.get(v, 0) + 1
    ax.scatter(v, seen[v], color="red" if v > upper_fence else "grey", s=45, zorder=3)
ax.axvspan(q1, q3, color="lightblue", label="Q1 to Q3 (IQR = 4)")
ax.axvline(lower_fence, color="black", linestyle="--", label="fences -3 and 13")
ax.axvline(upper_fence, color="black", linestyle="--")
ax.set_xticks([-3, 0, 3, 5, 7, 10, 13, 20, 27])
ax.set_yticks([])
ax.set_ylim(0, 5.5)
ax.set_title("The 19 values with the lower and upper fence")
ax.legend(loc="upper right")
plt.show()Q1: 3.0 Q3: 7.0 IQR: 4.0 fences: -3.0 13.0 outside the fences: [27]
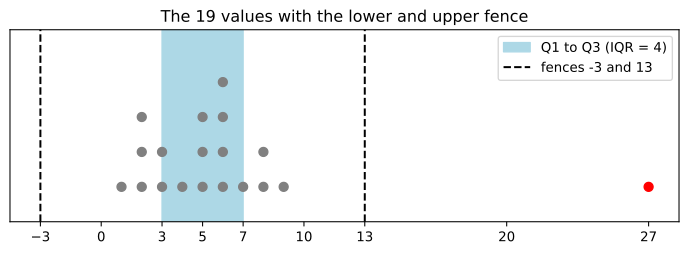
What the fences show
- Q1 = 3.0, Q3 = 7.0, IQR = 4.0, the board's values, because
method='weibull'is the (n + 1)p method. - The fences are −3.0 and 13.0, and the only value outside them is 27.
Running every quantile method on the 19 values
import numpy as np
import pandas as pd

data = [1, 2, 2, 2, 3, 3, 4, 5, 5, 5, 6, 6, 6, 6, 7, 8, 8, 9, 27]
for method in ["weibull", "linear", "hazen", "median_unbiased"]:
    q1, q3 = np.percentile(data, [25, 75], method=method)
    iqr = q3 - q1
    print(f"{method:16} Q1={q1:.3f}  Q3={q3:.3f}  IQR={iqr:.3f}"
          f"  fences={q1 - 1.5 * iqr:.3f}, {q3 + 1.5 * iqr:.3f}")
print("pandas quantile: ", pd.Series(data).quantile([0.25, 0.75]).tolist())

s = sorted(data)
print("Tukey hinges:    ", np.median(s[:9]), np.median(s[10:]))   # medians of the two halves

without = data[:-1]                                              # the 18 values without 27
q1w, q3w = np.percentile(without, [25, 75], method="weibull")
print("IQR without 27:", q3w - q1w)
print("sample SD with 27:", round(np.std(data, ddof=1), 2), " without:", round(np.std(without, ddof=1), 2))weibull Q1=3.000 Q3=7.000 IQR=4.000 fences=-3.000, 13.000 linear Q1=3.000 Q3=6.500 IQR=3.500 fences=-2.250, 11.750 hazen Q1=3.000 Q3=6.750 IQR=3.750 fences=-2.625, 12.375 median_unbiased Q1=3.000 Q3=6.833 IQR=3.833 fences=-2.750, 12.583 pandas quantile: [3.0, 6.5] Tukey hinges: 3.0 7.0 IQR without 27: 3.5 sample SD with 27: 5.56 without: 2.35
What the methods show
- Q1 is 3 for every method: the values around the 25th percentile are tied.
- Q3 ranges from 6.5 to 7: 7.0 with weibull, 6.5 with linear, 6.75 with hazen and 6.833 with median_unbiased.
- pandas agrees with NumPy's default, [3.0, 6.5].
- Tukey's hinges, the medians of the nine values on either side of the median, give 3.0 and 7.0, the same as the board.
- Without 27 the IQR moves only from 4 to 3.5, while the sample standard deviation drops from 5.56 to 2.35.
IQR vs standard deviation
| IQR | Standard deviation | |
|---|---|---|
| Measures | spread of the middle 50% | typical distance from the mean |
| Built from | two quartiles | every value |
| 27 in the 19 values | 4 with it, 3.5 without it | 5.56 with it, 2.35 without it |
| Pairs with | the median | the mean |
Where you use quartiles and the IQR
- Describing skewed data such as salaries or house prices: the median with Q1 and Q3 says more than the mean and the standard deviation.
- Flagging outliers with the 1.5 × IQR fences before training a model.
- Scaling features: scikit-learn's RobustScaler subtracts the median and divides by the IQR, so outliers do not squash the other values.
np.percentile(data, 75) gives 6.5 on the board's data, not 7, because NumPy's default is the linear method. When your answer must match a hand calculation or a textbook, pass method='weibull', and when you report quartiles, say which method you used.Related
- Previous: Percentiles and percentile rank
- Next: Five-number summary and box plot
- See also: Range, MAD and coefficient of variation
- Replace 27 with 12 and check whether it is still outside the fences.
- Add the value −50 to the data and find which fence it falls below.
- Run
stats.iqr(data, interpolation='weibull')and compare it with the linear default.
You understood something today that you didn't yesterday.