
One-sample z-test
A one-sample z-test is a hypothesis test that checks whether a population mean equals a stated value μ₀, using the sample mean and a known population standard deviation σ.
Last updated: 07 Oct, 2026 · SciPy 1.18
A new medication is given to 30 people. Their mean IQ is 140, while the population's is 100. Is that gap the drug, or could it be the luck of the sample? The z-test answers with one number and a fixed rule.
Setting up the IQ medication problem
The video's problem: in the population the average IQ is 100 with a standard deviation of 15. Researchers want to know whether a new medication has a positive or negative effect on intelligence, or no effect. A sample of 30 participants who took it has a mean IQ of 140.
- Hypothesized mean μ₀ = 100
- Population standard deviation σ = 15 (known)
- Sample size n = 30
- Sample mean x̄ = 140
- Significance level α = 0.05
A z-test needs σ to be known. It also needs the sample mean to follow a normal curve, which holds when the population is normal or the sample is large enough for the Central limit theorem (n ≥ 30 is the usual rule of thumb). When σ is unknown, the test to use is the One-sample t-test and the t distribution, whatever the sample size.
Stating the hypotheses and the decision rule
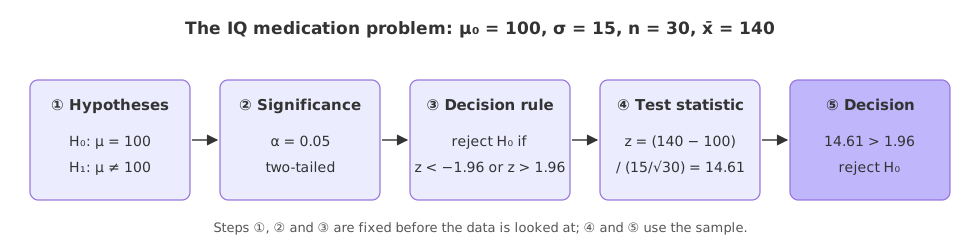
The null hypothesis says the medication changes nothing: H₀: μ = 100. The alternative says the mean is different: H₁: μ ≠ 100. The question asks about a positive or a negative effect, so the test is two-tailed: a z far out on either side counts against H₀.
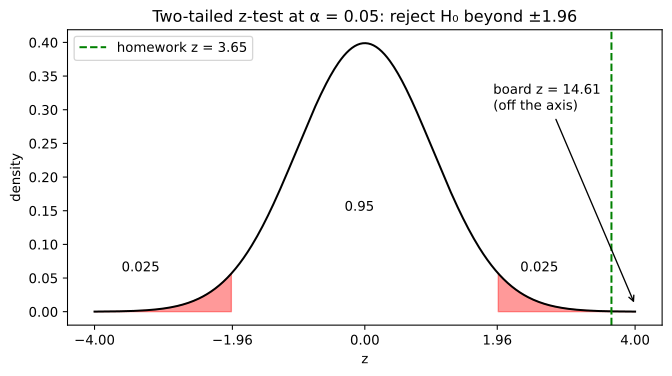
With α = 0.05 the confidence level is 1 − α = 95%. The 0.05 is split into 0.025 in each tail and 0.95 stays in the middle. The upper critical value is the z with 1 − 0.025 = 0.975 of the area to its left, which the z table gives as 1.96.
The decision rule, fixed before computing anything: reject H₀ if z < −1.96 or z > 1.96; otherwise fail to reject H₀.
Computing the z statistic
The test statistic measures how far the sample mean is from μ₀ in units of the standard error σ/√n, the standard deviation of the sample mean. A mean of 30 values varies less than a single value, because Var(x̄) = σ²/n for independent draws. For one observation (n = 1) the formula becomes the ordinary Z-score and the standard normal distribution, (x − μ)/σ.
Stating the decision
14.61 is far beyond 1.96, so we reject H₀. The data are strong evidence that the mean IQ of people who take the medication is not 100. The two-tailed test only says "different"; the sign of z gives the direction, and a positive z means the medication raised IQ.
The same decision comes from the P-value. For a two-tailed z-test p = 2 × (1 − Φ(|z|)), the area in both tails beyond the observed z. Here p is about 2.6 × 10⁻⁴⁸: if the true mean were 100, a sample of 30 with a mean at least 40 points away from 100 would essentially never occur. p ≤ α and |z| > 1.96 always agree.
The video leaves a homework: the same problem with a sample mean of 110. Then z = 10/(15/√30) = 3.65, which is still beyond 1.96, so H₀ is rejected again.
Running the z-test in Python
The z statistic from the board's numbers
import numpy as np
from scipy.stats import norm

mu0, sigma, n, xbar = 100, 15, 30, 140     # the board's problem
se = sigma / np.sqrt(n)                     # standard error of the mean
z = (xbar - mu0) / se
The critical value and the p-value
alpha = 0.05
z_crit = norm.ppf(1 - alpha / 2)            # 1.96 for a two-tailed test
p_value = 2 * norm.sf(abs(z)) # area in both tails beyond |z|for xbar in (140, 110): # the board's sample mean, then the homework
z = (xbar - mu0) / se
p_value = 2 * norm.sf(abs(z))
decision = "reject H0" if p_value <= alpha else "fail to reject H0"
print(f"x-bar {xbar}: z = {z:.2f}, critical ±{z_crit:.2f}, p = {p_value:.2g} -> {decision}")x-bar 140: z = 14.61, critical ±1.96, p = 2.6e-48 -> reject H0 x-bar 110: z = 3.65, critical ±1.96, p = 0.00026 -> reject H0
Drawing the rejection regions
import numpy as np
import matplotlib.pyplot as plt
from scipy.stats import norm

x = np.linspace(-4, 4, 400)
plt.figure(figsize=(8, 4))
plt.plot(x, norm.pdf(x), color="black")
for tail in (x <= -1.96, x >= 1.96):                 # the two rejection regions
    plt.fill_between(x[tail], norm.pdf(x[tail]), color="red", alpha=0.4)
plt.axvline(3.65, color="green", linestyle="--", label="homework z = 3.65")
plt.annotate("board z = 14.61\n(off the axis)", xy=(4, 0.01), xytext=(1.9, 0.3),
             arrowprops=dict(arrowstyle="->"))
plt.text(-0.3, 0.15, "0.95")
plt.text(-3.6, 0.06, "0.025")
plt.text(2.3, 0.06, "0.025")
plt.xticks([-4, -1.96, 0, 1.96, 4])
plt.title("Two-tailed z-test at α = 0.05: reject H₀ beyond ±1.96")
plt.xlabel("z")
plt.ylabel("density")
plt.legend(loc="upper left")
plt.show()
print("area in each red tail:", round(norm.sf(1.96), 4))area in each red tail: 0.025
Running a z-test on raw data with statsmodels
The video's notebook gives 20 patients' IQ scores, again from a population with μ = 100 and σ = 15, and calls ztest from statsmodels. Called with the hypothesized mean as the second argument, it fails:
from statsmodels.stats.weightstats import ztest

data = [88, 92, 94, 94, 96, 97, 97, 97, 99, 99,
        105, 109, 109, 109, 110, 112, 112, 113, 114, 115]
ztest(data, 100)Traceback (most recent call last):
File "main.py", line 5, in <module>
ztest(data, 100)
IndexError: tuple index out of rangeThe second positional parameter of ztest is x2, a second sample for a two-sample test. The hypothesized mean goes in value=:
z, p = ztest(data, value=100)               # value= is the hypothesized mean
print("ztest, value=100:", round(z, 4), " p =", round(p, 4))
z, p = ztest(data, value=110)
print("ztest, value=110:", round(z, 4), " p =", round(p, 5))ztest, value=100: 1.5976 p = 0.1101 ztest, value=110: -3.6405 p = 0.00027
Checking which standard deviation ztest uses
ztest never sees σ = 15. It estimates the standard deviation from the 20 values (with ddof = 1) and uses the normal distribution for the p-value, so it is a large-sample z-test. For a known-σ test, compute z yourself:
import numpy as np
from scipy.stats import norm, ttest_1samp

x = np.array(data)
s = x.std(ddof=1)                                    # what ztest divides by
z_known = (x.mean() - 100) / (15 / np.sqrt(len(x)))  # sigma = 15 is known
res = ttest_1samp(x, 100)
print("mean", x.mean(), " sample SD s =", round(s, 2), " sigma = 15")
print("known-sigma z =", round(z_known, 3), " p =", round(2 * norm.sf(abs(z_known)), 3))
print("t-test t =", round(res.statistic, 4), " p =", round(res.pvalue, 4), " df =", res.df)mean 103.05 sample SD s = 8.54 sigma = 15 known-sigma z = 0.909 p = 0.363 t-test t = 1.5976 p = 0.1266 df = 19
What the three p-values say
- ztest with value=100 gives z = 1.5976 and p = 0.1101. It divides by s = 8.54, the sample's own spread. p > 0.05, so we fail to reject H₀.
- The known-σ z-test gives z = 0.909 and p = 0.363. If the true mean were 100 with σ = 15, a sample of 20 with a mean at least 3.05 points from 100 would turn up in about 36% of samples. We fail to reject H₀: no evidence that the drug changes IQ. That is not proof of no effect; the sample is small.
- The t-test gives the same statistic as ztest, t = 1.5976, but p = 0.1266, because it uses the t distribution with 19 degrees of freedom. With σ unknown and n = 20, this is the textbook test.
- ztest with value=110 gives p = 0.00027. That is below 0.05, so we reject H₀: μ = 110. The sample mean 103.05 is far below 110.
Z-test vs t-test
| One-sample z-test | One-sample t-test | |
|---|---|---|
| Standard deviation | Population σ, known | Sample s, estimated |
| Reference distribution | Standard normal | t with n − 1 degrees of freedom |
| Two-tailed critical value, α = 0.05 | 1.96 | 2.045 at df 29, 2.093 at df 19 |
| In Python | By hand with scipy.stats.norm; statsmodels ztest uses s | scipy.stats.ttest_1samp |
| Use when | σ is known and the data are normal or n is large | σ is unknown |
Where you use a one-sample z-test
- Standardized scores: IQ and many exam scales are built with a published σ (15 for IQ), so a group's mean can be tested against the norm.
- Quality control: a filling machine whose spread is known from long running checks whether its mean fill has drifted from the target.
- Proportions and large samples: the Z-test for a proportion and tests on thousands of users in A/B experiments use the normal curve, because the standard error is known or estimated very precisely.
ztest estimates the standard deviation from the data and never uses a known σ, and its second positional argument is a second sample. For a known-σ test compute z = (x̄ − μ₀)/(σ/√n) and p = 2·norm.sf(|z|) yourself; with σ unknown and a small sample, use ttest_1samp.Related
- Previous: Type I and Type II errors
- Next: One-sample t-test and the t distribution
- See also: Hypothesis testing, P-value
- Reference: statsmodels ztest
- Change the board's sample mean to 104. Is z = 1.46 inside ±1.96, and what does the test decide?
- Set
alpha = 0.01. The critical value becomes 2.58; does the homework's z = 3.65 still reject H₀? - Run
ztest(data, value=100, alternative="larger")and compare its p-value with the two-sided 0.110.
Every expert started right here.