
Measurement scales
A measurement scale is the level at which a variable is measured, nominal, ordinal, interval or ratio, and it decides which comparisons and calculations are meaningful for that variable.
Last updated: 07 Oct, 2026 · SciPy 1.18
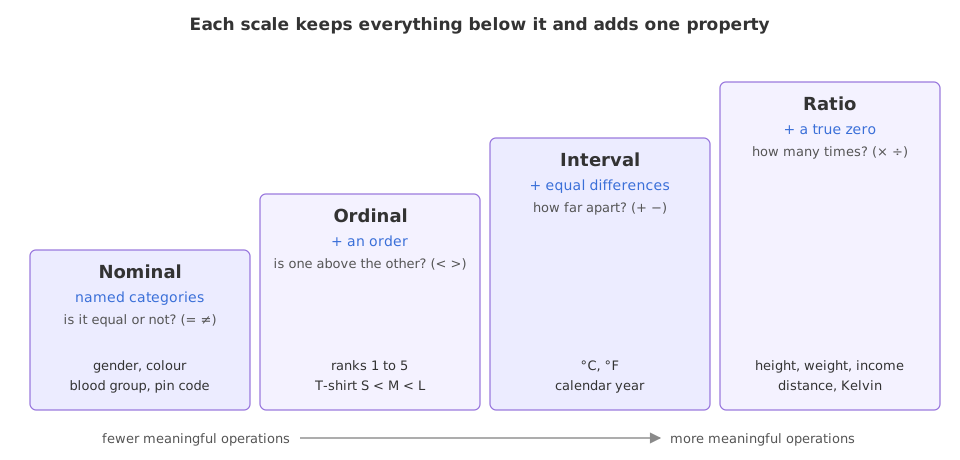
Types of variables split variables into numbers and categories. The four scales go one level deeper and say exactly what you may do with the values: count them, rank them, subtract them or divide them. A dataset mixes all four, so a good analysis checks the scale of each column.
Classifying the video's variables
The clip opens with a quiz of variables to classify. With the scales added, the answers are:
| Variable | Type | Scale |
|---|---|---|
| Gender | Categorical | Nominal |
| Marital status | Categorical | Nominal |
| River length | Continuous quantitative | Ratio |
| Population of a state | Discrete quantitative (a count) | Ratio |
| Song length | Continuous quantitative | Ratio |
| Blood pressure | Continuous quantitative | Ratio |
| Pin code | Categorical | Nominal |
The video leaves pin code open; it is nominal, because its digits are labels and no arithmetic on them means anything.
Naming categories with the nominal scale
Nominal data is categorical data split into classes with no order: colours, gender, the type of flower. The only comparison is equal or not equal (this flower is a rose, that one is not). The meaningful summaries are counts, percentages and the mode, the most common class.
Ranking with the ordinal scale
In ordinal data the order matters, but the size of the gaps does not. The video ranks five students by their marks:
| Marks | Rank |
|---|---|
| 100 | 1 |
| 96 | 2 |
| 57 | 4 |
| 85 | 3 |
| 44 | 5 |
The ranks keep the order and drop the distances. The gap between rank 1 and rank 2 is 4 marks (100 and 96); the gap between rank 3 and rank 4 is 28 marks (85 and 57). Rank 2 minus rank 1 equals rank 4 minus rank 3, yet the real differences are far apart, so averaging ranks or subtracting them misleads. For ordinal data use the median and percentiles. Other ordinal variables: T-shirt sizes, education level (school, bachelor's, master's, PhD), survey answers from "disagree" to "agree".
This is the answer to the interview question the video raises: nominal and ordinal data are both categorical, and only ordinal categories have a meaningful order.
Measuring differences with the interval scale
Interval data is numeric, ordered, and has equal steps: the difference between two values means the same everywhere on the scale. It has no true zero, a zero that means "none of the quantity". Temperature in °C or °F and calendar years are the standard examples.
0 °F is a real temperature, colder than 1 °F; it is not "no heat". So differences work: 80 °F − 70 °F and 90 °F − 80 °F are the same 10-degree rise. Ratios do not: 80 °F is not twice as hot as 40 °F. Convert both to Celsius and the same pair gives a ratio of 6, which shows the ratio depends on where each scale puts its zero, not on the heat. The code below works this out.
Measuring amounts with the ratio scale
Ratio data has everything interval data has, plus a true zero: 0 kg is no weight, 0 km is no distance. Ratios become meaningful: 80 kg is twice 40 kg in any unit. Height, weight, income, age, distance, time, counts and temperature in kelvin are ratio variables, and most quantitative variables in a dataset are.
Testing a ratio on two temperature scales
import numpy as np

f = np.array([40, 80, 70, 90])          # degrees Fahrenheit
c = (f - 32) * 5 / 9                    # the same temperatures in Celsius
k = c + 273.15                          # and in kelvin, which has a true zero
print("80 / 40 in F:", f[1] / f[0])
print("80 / 40 in C:", round(c[1] / c[0], 2))
print("80 / 40 in K:", round(k[1] / k[0], 3))
print("90-80 and 80-70 in F:", f[3] - f[1], f[1] - f[2])
print("the same gaps in C :", round(c[3] - c[1], 2), round(c[1] - c[2], 2))80 / 40 in F: 2.0 80 / 40 in C: 6.0 80 / 40 in K: 1.08 90-80 and 80-70 in F: 10 10 the same gaps in C : 5.56 5.56
The ratio of the same two temperatures is 2 in Fahrenheit, 6 in Celsius and about 1.08 in kelvin, so a ratio on an interval scale has no meaning. The two equal gaps stay equal in Celsius (5.56 degrees each), so differences do. Only the kelvin ratio describes the physics, because kelvin is a ratio scale.
Encoding nominal and ordinal variables
Machine learning models take numbers, so categories have to be encoded, and the scale decides how. Ordinal categories become ordered integer codes; nominal categories become one 0/1 column each (one-hot encoding), because numbering them 0, 1, 2 would invent an order.
Ranking the marks
import pandas as pd

marks = pd.Series([100, 96, 57, 85, 44])
ranks = marks.rank(ascending=False).astype(int)   # highest mark gets rank 1
Ordering the T-shirt sizes
sizes = pd.Categorical(["L", "S", "XL", "M", "S"],
                       categories=["S", "M", "L", "XL"], ordered=True)
codes = sizes.codes                                # S=0, M=1, L=2, XL=3
One-hot encoding the blood groups
blood = pd.Series(["A+", "O-", "B+", "A+"])
onehot = pd.get_dummies(blood, dtype=int)          # one 0/1 column per group
Printing the ranks and codes
print("marks:", marks.tolist(), " ranks:", ranks.tolist())
print("sizes:", list(sizes), " codes:", codes.tolist())
print("smallest:", sizes.min(), " largest:", sizes.max(), " below L:", (sizes < "L").tolist())
print(onehot.to_string())marks: [100, 96, 57, 85, 44] ranks: [1, 2, 4, 3, 5] sizes: ['L', 'S', 'XL', 'M', 'S'] codes: [2, 0, 3, 1, 0] smallest: S largest: XL below L: [False, True, False, True, True] A+ B+ O- 0 1 0 0 1 0 0 1 2 0 1 0 3 1 0 0
Reading the ranks and codes
- ranks [1, 2, 4, 3, 5]: the board's table, with 100 first and 44 last.
- codes [2, 0, 3, 1, 0]: L, S, XL, M, S in the order S < M < L < XL. Because the categorical is ordered,
min,maxand<work on sizes. - The one-hot table has one column per blood group and a single 1 in each row, so no group is "larger" than another.
Nominal vs ordinal vs interval vs ratio
| Nominal | Ordinal | Interval | Ratio | |
|---|---|---|---|---|
| Order | No | Yes | Yes | Yes |
| Equal differences | No | No | Yes | Yes |
| True zero | No | No | No | Yes |
| Meaningful centre | Mode | Median, mode | Mean, median, mode | Mean, median, mode |
| Examples | Gender, blood group, pin code | Ranks, T-shirt size | °C, °F, calendar year | Height, weight, income, kelvin |
| Encoding for a model | One-hot | Ordered codes | As a number | As a number |
Where you use measurement scales
- Choosing a summary: the mean of a nominal or ordinal variable is meaningless; report counts or the median.
- Encoding features: one-hot for nominal columns, ordered codes for ordinal ones.
- Choosing a test: tests on ranks, such as Spearman rank correlation, suit ordinal data; tests on means suit interval and ratio data, as Choosing a statistical test sets out.
Related
- Previous: Types of variables
- Next: Frequency distribution
- Reference: pandas get_dummies
- Add a sixth student with 96 marks to
marks. What doesrankgive the tie? Tryrank(ascending=False, method="min")too. - Remove
ordered=Truefrom the sizes and rerun. Which line now raises an error, and why? - Append −40 °F to the array with
f = np.append(f, -40). It is −40 in Celsius as well: what does that do to a "ratio" of temperatures?
Little by little, you're building something great.