
Percentiles and percentile rank
A percentile is a value below which a given percentage of the observations lie, and the percentile rank of a value is the percentage of observations that lie below it.
Last updated: 07 Oct, 2026 · SciPy 1.18
The mean and the standard deviation summarise data with a centre and a spread (Variance and standard deviation). Percentiles describe it by position instead: where a value stands among the others. They are also the first step to finding outliers.
Telling a percentage from a percentile
A percentage is a share of a total. Of the numbers 1, 2, 3, 4, 5, three are odd, so 3/5 = 0.6 = 60% of them are odd. A percentile is a position. Exams such as GATE, CAT, GMAT and SAT report percentiles: a student at the 99th percentile scored better than 99% of the students who sat the test, whatever the raw marks were.
Finding the percentile rank of 10
The board's dataset has n = 20 values, already sorted:
2, 2, 3, 4, 5, 5, 5, 6, 7, 8, 8, 8, 8, 8, 9, 9, 10, 11, 11, 12
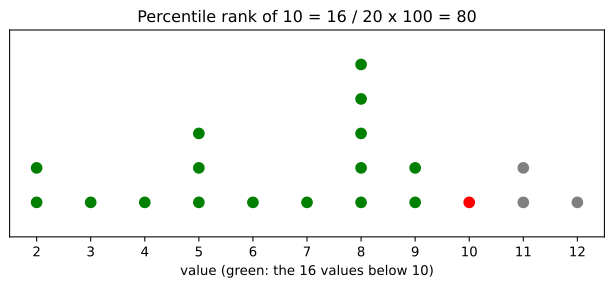
The question: what is the percentile rank of 10? Count the values below 10, divide by n and multiply by 100. Sixteen values lie below 10, so its percentile rank is 16/20 × 100 = 80. In words: 80% of the distribution is less than 10. The same count for 11 finds 17 values below it, so 11 has a percentile rank of 17/20 × 100 = 85.
The formula counts only the values strictly below x. Another common convention counts the values at or below x, which gives 85 for 10; a third splits the ties and gives 82.5. With repeated values the convention changes the answer, so name the one you use. scipy.stats.percentileofscore takes it as kind='strict', 'weak' or 'mean'.
Finding the value at the 25th percentile
The reverse question: what value sits at the 25th percentile? The formula gives a position in the sorted data, not the value itself:
Position 5.25 lies between the 5th and the 6th values. Both are 5, so the 25th percentile is 5. For the 75th percentile the position is 75/100 × 21 = 15.75, between the 15th and the 16th values, which are both 9, so the 75th percentile is 9.
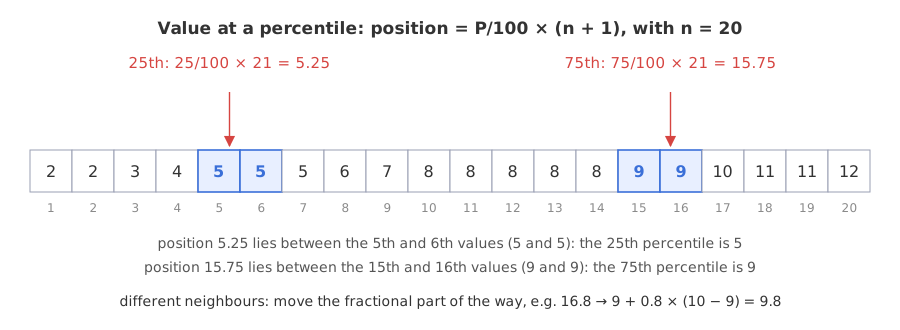
When the two neighbours differ, the fractional part of the position decides how far to move from the lower one to the upper one. The 80th percentile has position 0.8 × 21 = 16.8: the 16th value is 9 and the 17th is 10, so the value is 9 + 0.8 × (10 − 9) = 9.8.
The two formulas are not inverses. The percentile rank of 10 is 80, but the value at the 80th percentile is 9.8, not 10. One counts values below a point, the other places a point between two values.
Computing percentiles in Python
np.percentile and its method argument
np.percentile returns the value at one or more percentiles. Its default method is 'linear', which uses the position (n − 1)p + 1 instead of (n + 1)p. method='weibull' is the (n + 1)p method from the board, the one Excel calls PERCENTILE.EXC.
import numpy as np

np.percentile(scores, [25, 75])                     # default 'linear' method
np.percentile(scores, [25, 75], method="weibull")   # the (n + 1)p method
percentileofscore for the rank
from scipy import stats

stats.percentileofscore(scores, 10, kind="strict")   # % of values below 10
stats.percentileofscore(scores, 10, kind="weak")     # % of values at or below 10
Ranking and placing values in the 20 scores
import numpy as np
import matplotlib.pyplot as plt
from scipy import stats

scores = [2, 2, 3, 4, 5, 5, 5, 6, 7, 8, 8, 8, 8, 8, 9, 9, 10, 11, 11, 12]
n = len(scores)
for x in (10, 11):
    below = sum(v < x for v in scores)
    print(f"percentile rank of {x}: {below}/{n} x 100 = {below / n * 100}")
print("rank of 10, strict / mean / weak:",
      [float(stats.percentileofscore(scores, 10, kind=k)) for k in ("strict", "mean", "weak")])

def value_at(data, p):
    s = sorted(data)
    pos = p / 100 * (len(s) + 1)              # the (n + 1)p position
    k, frac = int(pos), pos - int(pos)
    return s[k - 1] + frac * (s[k] - s[k - 1])

for p in (25, 75, 80):
    print(f"{p}th: position {p / 100 * (n + 1):5.2f}  by hand {value_at(scores, p):.2f}"
          f"  weibull {np.percentile(scores, p, method='weibull'):.2f}"
          f"  numpy default {np.percentile(scores, p):.2f}")

fig, ax = plt.subplots(figsize=(8, 2.8))
seen = {}
for v in scores:
    seen[v] = seen.get(v, 0) + 1
    color = "green" if v < 10 else ("red" if v == 10 else "grey")
    ax.scatter(v, seen[v], color=color, s=60)
ax.set_xticks(range(2, 13))
ax.set_yticks([])
ax.set_ylim(0, 6)
ax.set_xlabel("value (green: the 16 values below 10)")
ax.set_title("Percentile rank of 10 = 16 / 20 x 100 = 80")
plt.show()percentile rank of 10: 16/20 x 100 = 80.0 percentile rank of 11: 17/20 x 100 = 85.0 rank of 10, strict / mean / weak: [80.0, 82.5, 85.0] 25th: position 5.25 by hand 5.00 weibull 5.00 numpy default 5.00 75th: position 15.75 by hand 9.00 weibull 9.00 numpy default 9.00 80th: position 16.80 by hand 9.80 weibull 9.80 numpy default 9.20
What the ranks and the positions show
- Ranks 80 and 85 for 10 and 11, the board's answers with the strict count.
- The three conventions give 80.0, 82.5 and 85.0 for the same value 10.
- The 25th and 75th percentiles are 5.00 and 9.00 by hand, with
method='weibull'and with NumPy's default: here the tied neighbours make every method agree. - The 80th percentile is 9.80 by the (n + 1)p method and 9.20 with NumPy's default, the first place on this data where the method changes the answer.
Percentage vs percentile vs percentile rank
| Percentage | Percentile | Percentile rank | |
|---|---|---|---|
| Answers | what share has a property? | which value has P% below it? | what % of values lie below x? |
| Input | a count and a total | a percentage P | a value x |
| Output | a percentage | a value of the data | a percentage |
| Example | 3 of 5 odd = 60% | 25th percentile = 5 | rank of 10 = 80 |
Where you use percentiles
- Exam and test scores, where the percentile says how a student did against everyone else.
- Growth charts: a child at the 90th percentile for height is taller than 90% of children of the same age.
- Response times of a web service, reported as the median, the 95th and the 99th percentile instead of the mean, because a few slow requests would distort it.
Related
- Previous: Skewness and kurtosis
- Next: Quartiles and the interquartile range
- Find the percentile rank of 8, which appears five times, with all three
kindvalues. - Compute
value_at(scores, 90)by hand from the position 18.9, then check it againstmethod='weibull'. - Try
value_at(scores, 99)and read the error: position 20.79 lies past the 20th value, so there is no 21st value to move towards. Compare it withnp.percentile(scores, 99, method='weibull').
Little by little, you're building something great.