
Descriptive and inferential statistics
Descriptive and inferential statistics are the two branches of statistics: descriptive statistics summarizes the data you have, and inferential statistics uses a sample to draw conclusions about the larger population it came from.
Last updated: 07 Oct, 2026 · SciPy 1.18
The overview, Statistics, named the two branches. Every method in the course belongs to one of them, so telling them apart is the first decision in any analysis: are you describing these numbers, or using them to say something about numbers you never collected?
Asking a descriptive question
Descriptive statistics consists of organizing and summarizing data. The video's example is a classroom of maths students and their first-semester marks, in percent:
84, 86, 78, 72, 75, 65, 80, 81, 92, 95, 96, 97
"What is the average mark of the students in the class?" is a descriptive question. The answer comes from these 12 numbers alone. So do the other summaries the video lists: the mode, the standard deviation, or the percentage of students who passed. Tables and charts of the marks are descriptive too.
Asking an inferential question
Inferential statistics uses the data you have to form conclusions about data you do not have. The video's question: are the marks of the students of this classroom similar to the marks of the maths classrooms in the whole college? Say the college has five maths classrooms and only this one was measured. The five classrooms are the population and the one classroom is the sample.
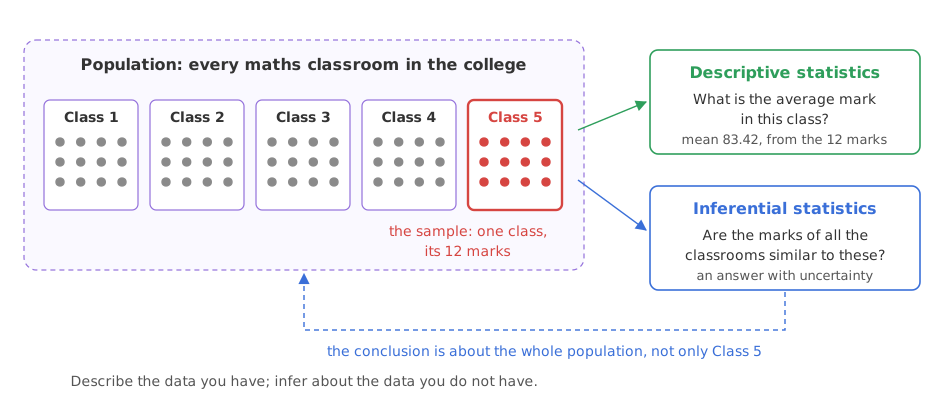
The answer to an inferential question is never certain, because the other classrooms were not measured. Inferential methods say how uncertain it is: a confidence interval gives a range for the population's average mark, and a hypothesis test says whether the sample is consistent with a claim about the population.
How much a sample can tell you depends on how it was chosen. One whole classroom is a group that was easy to take, not a random draw of students from the college; if that class has a stronger teacher, its marks say little about the others. Sampling techniques covers the ways to draw a sample that represents its population.
Summarizing the 12 marks in Python
The descriptive answers take one line each in pandas:
import pandas as pd

marks = pd.Series([84, 86, 78, 72, 75, 65, 80, 81, 92, 95, 96, 97])
print("count  :", marks.count())
print("mean   :", round(marks.mean(), 2))
print("median :", marks.median())
print("lowest :", marks.min(), "  highest:", marks.max())
print("spread from lowest to highest:", marks.max() - marks.min())count : 12 mean : 83.42 median : 82.5 lowest : 65 highest: 97 spread from lowest to highest: 32
Reading the class summary
- count 12: the board lists 12 marks.
- mean 83.42: the answer to the video's descriptive question, the average mark of the class (1001 ÷ 12).
- median 82.5: half the marks are below 82.5 and half above, the middle of 81 and 84 once the marks are sorted. Mean, median and mode explains when the two differ.
- lowest 65, highest 97: the marks cover 32 points.
- None of these numbers says anything certain about the other four classrooms. That step is inference.
Descriptive vs inferential statistics
| Descriptive statistics | Inferential statistics | |
|---|---|---|
| Question | What do these data look like? | What do these data say about the population? |
| Data used | All the data in hand | A sample, standing in for a population |
| Answer | Exact for the data in hand | Comes with a measured uncertainty |
| Tools | Tables, charts, mean, median, mode, standard deviation, percentiles | Confidence intervals, hypothesis tests, p-values, z, t, chi-square and ANOVA tests |
| The video's example | Average mark of the one class | Are the marks similar across the college's maths classrooms? |
Where you use descriptive and inferential statistics
- A sales dashboard is descriptive: total sales, average order value and a chart per month, for the orders already placed.
- An A/B test is inferential: a new checkout page is shown to a sample of visitors, and a test decides whether its higher sales would hold for all visitors or could be chance.
- An exit poll is inferential: a sample of voters is asked, and the result is used to predict how the whole state voted, as Population and sample shows.
Related
- Previous: Installing Python for statistics
- Next: Population and sample
- See also: Mean, median and mode
- The notes use the ages of one of 20 maths classes instead:
[21, 20, 18, 34, 17, 22, 24, 25, 26, 23, 22]. Put them in the Series. Is the mean 22.91 and the median 22? - Print
marks.describe()for all the descriptive summaries at once. - Count how many marks are 80 or above with
(marks >= 80).sum(), and turn it into a share with(marks >= 80).mean().
You understood something today that you didn't yesterday.