
Types of variables
A variable is a characteristic recorded for each member of a dataset whose value can change from one member to the next; it is quantitative when its values are numbers and qualitative when they are categories.
Last updated: 07 Oct, 2026 · SciPy 1.18
A sample, chosen with one of the Sampling techniques, gives a table: one row per member, one column per variable. The type of each column decides which summaries and charts make sense, so it is the first thing to check in any dataset.
Defining a variable
The video's examples are height and weight. Height takes values such as 182, 178, 168, 150, 160 and 170 cm; weight takes 78, 99, 100, 60 and 50 kg. A variable does not take any value at all: a blood group is always one of eight, and a height is never negative. It takes one value from its set for each member.
Measuring quantitative variables
A quantitative variable is measured as a number: age, weight, height. The numbers mean amounts, so arithmetic on them is meaningful: you can add weights, subtract heights and average ages. How much arithmetic is allowed depends on the variable's scale, as Measurement scales shows (a temperature of 20 °C is not twice as warm as 10 °C).
Grouping qualitative variables
A qualitative or categorical variable puts each member into a category: gender (male, female), blood group (A positive, A negative, ...), T-shirt size (small, medium, large, XL). Adding or averaging the categories means nothing; you count how many members fall in each.
A categorical variable can also be made from a number, by cutting it into bands. The video bins IQ scores into "less", "medium" and "good". Banding keeps the order of the numbers, so the bands are ordered categories, like the T-shirt sizes: small comes before medium before large. Categories with an order are ordinal; categories without one, like blood groups, are nominal.
Telling discrete from continuous variables
Quantitative variables split in two. A discrete variable takes separate, countable values with gaps between them. The video's examples are counts: the number of bank accounts a person has (2, 3, 4, 5, 6, 7, never 2.5) and the number of children in a family.
A continuous variable can take any value in a range, limited only by how precisely it is measured: a height of 172.5 cm, 162 cm or 163.5 cm; a weight of 100 kg, 99.5 kg or 99.75 kg; rainfall of 1.1, 1.25 or 1.35 inches.
Counts are the usual discrete variables, and a discrete scale can also have steps of a half: shoe sizes 7, 7.5 and 8 are discrete, because nothing lies between the sizes on offer. And a continuous variable is often recorded in rounded steps: age is continuous, but a dataset usually stores it in whole years.
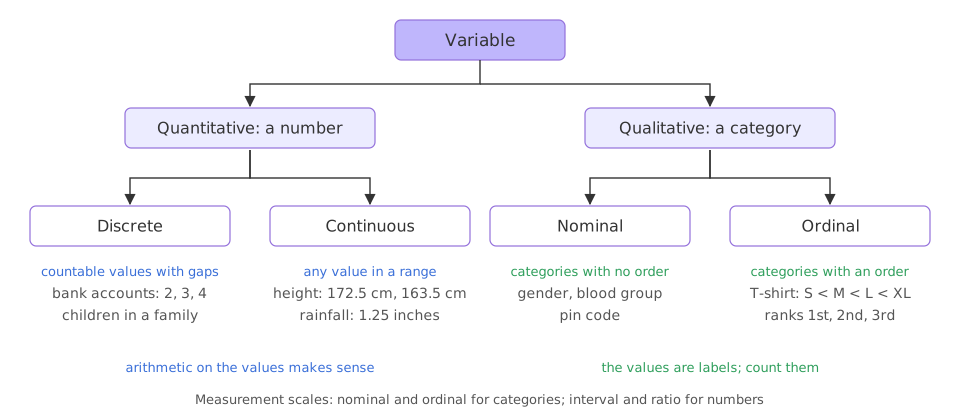
The notes end with four to classify. Marital status is categorical. The length of the Nile and the duration of a movie are continuous quantitative. IQ is quantitative, reported as whole numbers on a continuous scale.
Reading variable types in pandas
pandas stores each column with a dtype that hints at its type: float64 for decimals, int64 for whole numbers, category or str for labels. The tips dataset has all three kinds:
import seaborn as sns

tips = sns.load_dataset("tips")
print(tips.head(3).to_string())
print()
kinds = tips.dtypes.astype(str).to_frame("dtype")
kinds["distinct values"] = tips.nunique()
print(kinds.to_string()) total_bill tip sex smoker day time size
0 16.99 1.01 Female No Sun Dinner 2
1 10.34 1.66 Male No Sun Dinner 3
2 21.01 3.50 Male No Sun Dinner 3
dtype distinct values
total_bill float64 229
tip float64 123
sex category 2
smoker category 2
day category 4
time category 2
size int64 6Reading the tips columns
total_billandtiparefloat64with many distinct values: amounts of money, continuous quantitative variables (recorded to the cent).sizeisint64with 6 distinct values: the number of people at the table, a discrete count.sex,smoker,dayandtimearecategorywith 2 to 4 values: qualitative variables. Days of the week have an order; smoker or not does not.
Spotting a number that is a category
A dtype is a hint, not the answer. A pin code is stored as a whole number, yet it is a label: 560034 is not "more" than 110001 in any useful sense. The video leaves pin code as a question; it is a categorical variable. Treated as a number, it gives an average with no meaning:
import pandas as pd

shops = pd.DataFrame({"pin_code": [560001, 560034, 110001, 400050, 560001]})
print("mean pin code:", shops["pin_code"].mean())           # a number with no meaning

shops["pin_code"] = shops["pin_code"].astype("category")     # store it as a label
print(shops["pin_code"].value_counts().to_string())mean pin code: 438017.4 pin_code 560001 2 110001 1 400050 1 560034 1
As a category, the right summary is a count per code: 560001 appears twice. Phone numbers, roll numbers and customer ids are the same kind of variable.
Discrete vs continuous variables
| Discrete | Continuous | |
|---|---|---|
| Values | Separate, countable, with gaps | Any value in a range |
| Typical source | Counting | Measuring |
| The video's examples | Bank accounts, children in a family | Height, weight, rainfall |
| Other examples | Number of employees, shoe size, people at a table | Song length, river length, blood pressure |
| Usual chart | Bar chart when there are few values, histogram when many | Histogram |
Where you use variable types
- Choosing a chart: a bar chart for categories and a histogram for numbers, as Bar charts and pie charts and Histograms show.
- Choosing a summary: an average for a quantitative variable, counts and the most common category for a qualitative one.
- Preparing data for machine learning: numbers are scaled, categories are encoded as columns of 0s and 1s, which Measurement scales shows.
int64, and describe() will report their mean and standard deviation without complaint. Convert them with astype("category") before summarizing.Related
- Previous: Sampling techniques
- Next: Measurement scales
- Reference: pandas categorical data
- Print
tips.select_dtypes("number").columnsandtips.select_dtypes("category").columnsto split the columns by kind. - Print
tips["size"].value_counts().sort_index(). Why can there be no table of 2.5 people? - Run
shops.describe()before and after theastype("category")line and compare what pandas reports.
Every expert started right here.