
Population and sample
A population is the complete set of people or items a question is about, and a sample is the part of it that is observed and measured.
Last updated: 07 Oct, 2026 · SciPy 1.18
Descriptive and inferential statistics called one classroom a sample of the college's classrooms. The two words carry most of statistics: a sample is cheap to measure, the population is what the question is about, and inference bridges the gap.
Taking a sample in an exit poll
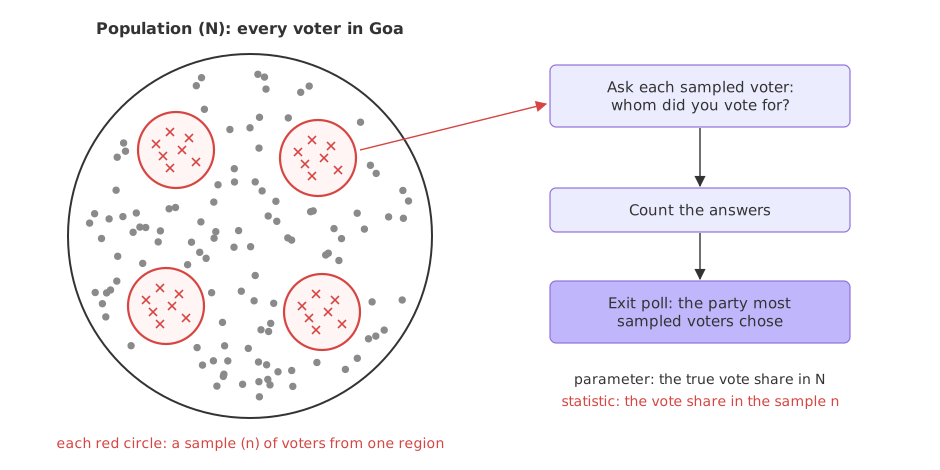
The video's example is an election, in Goa or in UP. Once voting ends, reporters want to call the result before the official count: an exit poll. They cannot ask every voter whom they voted for. Some voters are travelling, some cannot be found, and asking millions of people is not possible anyway.
So they take samples of voters from different regions, ask each one whom they voted for, and announce the party most of the sampled voters chose. Every voter in Goa is the population; the voters the reporters asked are the sample.
Writing the sizes N and n
The size of the population is written with a capital N and the size of the sample with a small n. A sample is part of its population, so n is at most N, and in practice much smaller: an exit poll might ask a few thousand of a state's voters.
A sample is used instead of the population when measuring everyone is too slow, too expensive or impossible: every voter, every tablet in a factory (testing a tablet destroys it), every user of an app.
Telling a parameter from a statistic
A number that describes the population is a parameter; the same number computed on a sample is a statistic. The parameter is fixed but usually unknown. The statistic is known, and it changes from one sample to the next. Inferential statistics uses the statistic to estimate the parameter.
| Measure | Population parameter | Sample statistic |
|---|---|---|
| Size | N | n |
| Mean | μ (mu) | x̄ (x-bar) |
| Standard deviation | σ (sigma) | s |
| Proportion | p | p̂ (p-hat) |
The two means use the same arithmetic on different data: all N values or the n values in the sample.
In the exit poll, the parameter is the share of all of Goa's voters who chose a party, p, and the statistic is the share in the sample, p̂. Real exit polls do not pick voters one by one from the whole state: they choose polling stations, then question every k-th voter leaving each station, designs that Sampling techniques explains.
Simulating an exit poll
A simulation makes the parameter visible, which a real election never does. It builds a state of 100,000 voters in which about 52% chose party A, then runs five exit polls of 1,000 voters each.
Building the population of voters
import numpy as np

rng = np.random.default_rng(42)
N = 100_000                          # every voter in the state
votes = rng.random(N) < 0.52         # True = this voter chose party A
p = votes.mean()                     # the parameter: the true share for A
Polling a sample of 1,000 voters
n = 1_000
sample = rng.choice(votes, size=n, replace=False)   # 1,000 different voters
p_hat = sample.mean()                               # the statistic: the sample's share for A
Running five exit polls
print("population N =", N, "  parameter p =", round(p, 4))
for poll in range(1, 6):
    sample = rng.choice(votes, size=n, replace=False)
print(f"exit poll {poll}: n = {n} statistic p_hat = {sample.mean():.3f}")population N = 100000 parameter p = 0.5181 exit poll 1: n = 1000 statistic p_hat = 0.508 exit poll 2: n = 1000 statistic p_hat = 0.503 exit poll 3: n = 1000 statistic p_hat = 0.490 exit poll 4: n = 1000 statistic p_hat = 0.537 exit poll 5: n = 1000 statistic p_hat = 0.495
Reading the five polls
- The parameter p = 0.5181 is one number: the share of all 100,000 voters who chose A. Only a simulation can print it.
- Each poll gives a different statistic, because each asks a different 1,000 voters. This sample-to-sample variation is why an inference comes with an error margin.
- The polls scatter around the parameter of 0.518, from 0.490 to 0.537. Polls 3 and 5 put party A under half the vote although it won 51.8%: in a race this close, a single poll can point to the wrong winner, which is why Point estimates and standard error and Confidence intervals measure how far a statistic usually falls from its parameter.
Population vs sample
| Population | Sample | |
|---|---|---|
| What it is | Everyone the question is about | The part that is measured |
| Size | N | n, at most N |
| Its numbers are called | Parameters (μ, σ, p) | Statistics (x̄, s, p̂) |
| Known? | Usually not | Yes, computed from the data |
| Changes between samples? | No, it is fixed | Yes |
| In the exit poll | Every voter in Goa | The voters the reporters asked |
Where you use populations and samples
- Surveys and polls: a few thousand answers stand in for millions of people.
- Quality control: a factory tests a sample of each batch, because testing every item would destroy the batch.
- Machine learning: the training data is a sample of the data a model will meet later, which is why a model is checked on held-out rows, as in Train and test split.
Related
- Previous: Descriptive and inferential statistics
- Next: Sampling techniques
- See also: Point estimates and standard error
- Set
n = 100in the loop. Do the five statistics spread further from the parameter? - Change
0.52to0.60. How often does a poll now point to the wrong winner? - Replace the loop body with
print(rng.choice(votes, size=N, replace=False).mean()). A "sample" of all N voters gives back the parameter exactly.
Slow is fine. Stopping is the only problem.