
Significance level, one-tailed and two-tailed tests
A one-tailed test is a hypothesis test that puts the whole significance level α in the one tail H₁ points to, while a two-tailed test splits α equally between both tails of the null distribution.
Last updated: 07 Oct, 2026 · SciPy 1.18
The P-value lesson compared p with α. This lesson pins down α itself and shows how the wording of H₁ decides which tail, or both, the rejection region and the p-value use.
Choosing the significance level α
The significance level α is the probability of rejecting H₀ when H₀ is true, the Type I error rate the analyst is willing to accept. It is fixed before the data are seen, from the cost of a false alarm. The confidence level of the matching interval is 1 − α.
- α = 0.05 (95% confidence): the common default.
- α = 0.01 or smaller: when a false alarm is costly, as in medical and safety decisions such as approving a vaccine.
- α = 0.10: early exploratory work, where missing an effect costs more than a false alarm.
A larger α makes the rejection region bigger and the test easier to reject; a smaller α makes it stricter.
Reading the question to pick the tail
The video's example: colleges in Karnataka have an 85% placement rate. A new college opened recently, and a sample of 150 of its students had a placement rate of 88%. Does this college have a different placement rate?
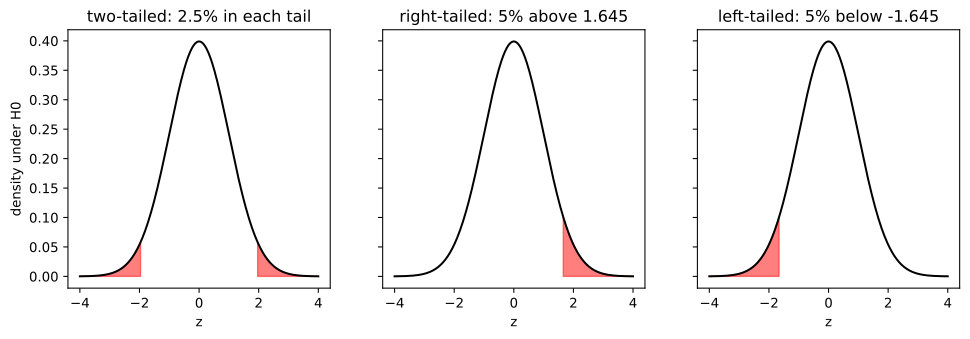
- "Different": the new college's rate could be greater or less than 85%. H₁: p ≠ 0.85 is two-tailed, and α = 0.05 is split as 2.5% in each tail, with 95% in the middle.
- "Greater than 85%": only a high rate counts as evidence. H₁: p > 0.85 is right-tailed, and the whole 5% sits in the right tail; α is not divided.
- "Less than 85%": H₁: p < 0.85 is left-tailed, with all 5% in the left tail.
The curve in each picture is the null distribution of the sample rate, centred at the hypothesised 85%. The keyword in the question (different, greater, less) fixes the tail, and it must be fixed before the data are seen.
Finding critical values for one and two tails
At α = 0.05, a two-tailed z test needs an area of 0.975 to the left of the upper cut, z = 1.96. A one-tailed test needs 0.95, z = 1.645. The one-tailed cut is closer to 0 because all of α sits in one tail.
import numpy as np
import matplotlib.pyplot as plt
from scipy.stats import norm

two, one = norm.ppf(0.975), norm.ppf(0.95)
print("two-tailed, alpha 0.05: ±" + str(round(two, 3)))
print("right-tailed:", round(one, 3), "  left-tailed:", round(-one, 3))

x = np.linspace(-4, 4, 500)
y = norm.pdf(x)
panels = [("two-tailed: 2.5% in each tail", np.abs(x) >= two),
          ("right-tailed: 5% above 1.645", x >= one),
          ("left-tailed: 5% below -1.645", x <= -one)]
fig, axes = plt.subplots(1, 3, figsize=(12, 3.5), sharey=True)
for ax, (title, region) in zip(axes, panels):
    ax.plot(x, y, color="black")
    ax.fill_between(x, y, where=region, color="red", alpha=0.5)
    ax.set_title(title)
    ax.set_xlabel("z")
axes[0].set_ylabel("density under H0")
plt.show()two-tailed, alpha 0.05: ±1.96 right-tailed: 1.645 left-tailed: -1.645
Testing the new college and the underfed boys
To test the college, treat the placement rate as a proportion: n = 150, sample proportion p̂ = 0.88, H₀: p = 0.85. Under H₀ the standard error of p̂ is √(p₀(1 − p₀)/n), and z = (p̂ − p₀)/SE. The Z-test for a proportion lesson covers this test in full.
The board notes add a left-tailed example: the average weight of 10-year-old boys is 32 kg with σ = 9 kg. A sample of 25 boys from a municipal school has mean 29.5 kg. Are the boys underfed? "Underfed" means lighter, so H₁: μ < 32, a left-tailed test.
import math
from scipy.stats import norm

# College: H0 p = 0.85; a sample of 150 students, 88% placed
se = math.sqrt(0.85 * 0.15 / 150)
z = (0.88 - 0.85) / se
print("college: SE =", round(se, 4), "  z =", round(z, 3))
print("  'different from 85%' (two-tailed) p =", round(2 * norm.sf(abs(z)), 4))
print("  'greater than 85%' (right-tailed) p =", round(norm.sf(z), 4))

# Boys: H0 mu = 32 kg, H1 mu < 32, sigma 9, n 25, sample mean 29.5
zb = (29.5 - 32) / (9 / math.sqrt(25))
print("boys: z =", round(zb, 3), "  left-tailed p =", round(norm.cdf(zb), 4),
      "  critical value", round(norm.ppf(0.05), 3))

# choosing the tail after looking at the data: reject whenever |z| > 1.645
print("Type I error rate if the tail is picked after the data:", round(2 * norm.sf(1.645), 3))college: SE = 0.0292 z = 1.029 'different from 85%' (two-tailed) p = 0.3035 'greater than 85%' (right-tailed) p = 0.1517 boys: z = -1.389 left-tailed p = 0.0824 critical value -1.645 Type I error rate if the tail is picked after the data: 0.1
What the two tests decided
- The college: z = 1.029. Two-tailed p = 0.3035 and right-tailed p = 0.1517. Both are above 0.05, so fail to reject H₀: a 3-point lead in a sample of 150 is no evidence that the college's rate differs from 85%.
- The one-tailed p is half the two-tailed p when z falls on the side H₁ points to: only one tail is counted.
- The boys: z = −1.389, above the left-tailed critical value −1.645, with p = 0.0824 > 0.05. Fail to reject H₀: the sample does not show the boys are underweight.
- Picking the tail after seeing the data rejects whenever |z| > 1.645, a Type I error rate of 0.1, double the stated 0.05.
One-tailed vs two-tailed test
| Two-tailed | One-tailed | |
|---|---|---|
| H₁ | μ ≠ μ₀ ("different") | μ > μ₀ or μ < μ₀ ("greater", "less") |
| Where α goes | α/2 in each tail | All of α in one tail |
| z critical value, α = 0.05 | ±1.96 | 1.645 or −1.645 |
| p-value from z | 2 × (1 − Φ(|z|)) | 1 − Φ(z) or Φ(z) |
| SciPy keyword | alternative="two-sided" (the default) | alternative="greater" or "less" |
Where you use one-tailed and two-tailed tests
- Two-tailed is the safe default: "has the average delivery time changed?" A change in either direction matters.
- Right-tailed: a new drug is approved only if it beats the placebo; doing worse is not the claim being tested.
- Left-tailed: a battery maker claims a life of at least 2 years, and a buyer tests whether the true mean is less.
Related
- Previous: P-value
- Next: Type I and Type II errors
- Reference: scipy.stats.ttest_1samp (the alternative parameter)
- Print
norm.ppf(0.995)andnorm.ppf(0.99): the two-tailed and one-tailed critical values at α = 0.01. - Give the college 95% placement in the sample (
0.95instead of0.88). Do both tests reject now? - Change the boys' sample mean to 28.5. Which side of −1.645 does z land on?
Slow is fine. Stopping is the only problem.