
Sampling techniques
A sampling technique is a rule for choosing which members of a population go into the sample; a probability technique gives every member a known chance of being chosen, which is what lets a sample stand in for its population.
Last updated: 07 Oct, 2026 · SciPy 1.18
Population and sample ended on a question the video also asks: should a sample be picked at random, or is there a better way? The answer depends on the population and the question, and each technique below fits a different situation.
Picking a simple random sample
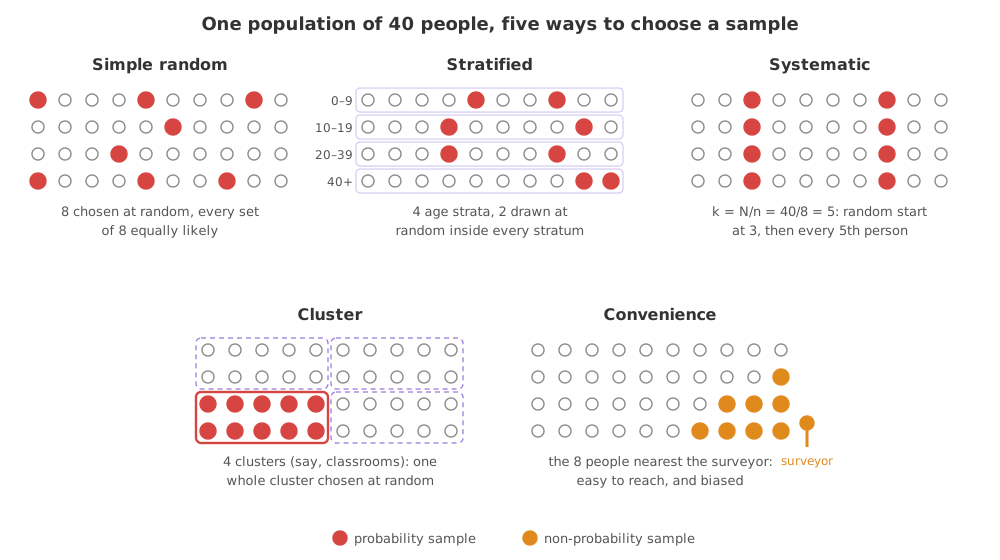
The most used technique is simple random sampling: go to the population and pick people at random, with no rule about who. When performing simple random sampling, every member of the population has an equal chance of being selected for the sample. The full definition is a little stronger: every possible group of n members is equally likely to be the sample, and nobody is picked twice.
The video uses it for an exit poll, and points out that a test of a medicine needs more: the people are first checked against their medical history. In a drug trial that check decides who is eligible; a random draw then decides which eligible people get the drug and which get a placebo.
Splitting the population into strata
Stratified sampling splits the population N into non-overlapping groups called strata (layers), then draws a simple random sample inside every stratum, usually in proportion to its size. A survey might split people by gender, because men and women may answer differently, and sample both. Or it splits them by age group.
Non-overlapping is the key word: every member must fall in exactly one stratum. With ages in whole years, groups such as 0 to 9, 10 to 19, 20 to 39 and 40 to 100 do that, since no age sits in two of them. Profession is a harder case, as the video notes: a PHP developer may also know .NET and Python. The fix is one rule that gives everyone one stratum, such as each person's main job title, which works for doctors and engineers alike. The notes list more strata: blood groups, tax slabs and education level.
Taking every k-th member
Systematic sampling takes members at a fixed step from a list or a queue. The video's example is a survey about Covid outside a mall: stop every eighth person who walks past. The step is fixed in advance, and there is no reason behind choosing the eighth person rather than the seventh.
To get n members from N, the step is k = N/n. The first member is picked at random between 1 and k, and then every k-th member after it. A list with a repeating pattern can spoil it: if every tenth flat in a building list is a corner flat and k is 10, the sample may be all corner flats, or none.
Sampling whole clusters
Cluster sampling splits the population into groups that each look like a small copy of it, such as classrooms, villages or polling stations, picks some whole groups at random, and measures everyone in them. It is cheaper than visiting members scattered everywhere. Its weakness is the one in the video's classroom example: with a single cluster, there is no way to tell how much the clusters differ.
Stratified and cluster sampling both split the population into groups, and they use the groups in opposite ways. Stratified sampling takes some members from every group; cluster sampling takes every member from some groups. Real exit polls combine them: polling stations are chosen at random within regions, then every k-th voter leaving each station is asked. The notes sum up the exit poll as "stratified + random sampling".
Choosing convenience and other non-probability samples
Some samples give members no known chance of selection. They are quick, and they are biased in ways that cannot be measured, so their results do not carry over to a population:
- Convenience sampling takes whoever is easiest to reach: shoppers at one mall entrance, your own followers, the first 50 people who reply.
- Voluntary response sampling takes only the people who choose to answer, such as a poll under a YouTube video. People with strong opinions answer more.
- Purposive (judgement) sampling chooses people for what they know. A survey about data science sent only to people who know data science, as in the video, is one: useful for expert opinion, not for describing everyone.
Sampling with and without replacement
A simple random sample is drawn without replacement: once a person is picked, they cannot be picked again. NumPy's choice draws with replacement unless told otherwise, so the same person can appear twice. The hypothesis-testing notebook in the notes draws its sample of ages this way. Here are its 32 ages, sampled by position both ways:
import numpy as np

ages = [10, 20, 35, 50, 28, 40, 55, 18, 16, 55, 30, 25, 43, 18, 30, 28,
        14, 24, 16, 17, 32, 35, 26, 27, 65, 18, 43, 23, 21, 20, 19, 70]
rng = np.random.default_rng(42)

picked = rng.choice(len(ages), size=10)                  # replace=True by default
print("with replacement   :", sorted(picked.tolist()))
picked = rng.choice(len(ages), size=10, replace=False)   # a simple random sample
print("without replacement:", sorted(picked.tolist()))
print("their ages :", [ages[i] for i in sorted(picked.tolist())])with replacement : [2, 2, 3, 6, 13, 14, 20, 22, 24, 27] without replacement: [3, 12, 14, 18, 19, 22, 23, 26, 30, 31] their ages : [50, 43, 30, 16, 17, 26, 27, 43, 19, 70]
The first draw picks the person at position 2 twice. With replace=False the ten positions are all different. pandas' df.sample is the other way round: it draws without replacement unless you pass replace=True.
Sampling a school in pandas
Each technique is one or two lines on a DataFrame. The population is a made-up school of 200 students in five classrooms of 40, like the video's college, with a gender and a mark for each student.
The school of 200 students
import numpy as np
import pandas as pd

rng = np.random.default_rng(42)
school = pd.DataFrame({
    "student": np.arange(1, 201),
    "classroom": np.repeat(list("ABCDE"), 40),       # 5 classrooms of 40
    "gender": rng.choice(["F", "M"], size=200),
    "marks": rng.normal(75, 10, size=200).round().clip(0, 100),
})
A simple random sample with sample
srs = school.sample(n=20, random_state=42) # 20 students, no repeatsA stratified sample with groupby
strat = school.groupby("gender").sample(frac=0.1, random_state=42) # 10% of each genderA systematic sample with a step
k = len(school) // 20                       # N / n = 200 / 20 = 10
start = int(rng.integers(1, k + 1))         # a random start between 1 and k
syst = school.iloc[start - 1 :: k]          # then every k-th student
A cluster sample of whole classrooms
chosen = rng.choice(list("ABCDE"), size=2, replace=False)   # 2 whole classrooms
clus = school[school["classroom"].isin(chosen)]
Comparing the four samples with the school
for name, s in [("population", school), ("simple random", srs), ("stratified", strat),
                ("systematic", syst), ("cluster", clus)]:
    share_f = (s["gender"] == "F").mean()
    print(f"{name:14} n = {len(s):3}   mean mark = {s['marks'].mean():.2f}   share F = {share_f:.2f}")
print("systematic start:", start, " clusters:", sorted(chosen.tolist()))population n = 200 mean mark = 74.62 share F = 0.49 simple random n = 20 mean mark = 77.95 share F = 0.45 stratified n = 20 mean mark = 77.05 share F = 0.50 systematic n = 20 mean mark = 74.90 share F = 0.35 cluster n = 80 mean mark = 74.21 share F = 0.49 systematic start: 5 clusters: ['A', 'B']
Reading the samples
- The population row holds the parameters: the school's mean mark and share of girls, which the samples try to estimate.
- Every sample's mean mark is close to the school's but not equal to it, by a different amount each time. That is the sample-to-sample variation of Population and sample.
- The stratified sample matches the gender split almost exactly, because it was drawn as 10% of each gender. The simple random and systematic samples get it right only on average.
- The cluster sample is the largest, 80 students from two whole classrooms, because it keeps everyone in each chosen cluster.
Stratified vs cluster sampling
| Stratified sampling | Cluster sampling | |
|---|---|---|
| Groups | Strata: alike inside, different from each other | Clusters: each a small copy of the population |
| What is drawn | Some members from every group | Every member of some groups |
| Main gain | Every group is represented, estimates vary less | Cheaper: fewer places to visit |
| Main risk | Needs a list of every member's group | Few clusters give estimates that vary more |
| Example | 10% of each gender, each age group | Two whole classrooms, some polling stations |
Where you use each sampling technique
- Surveys and exit polls combine strata (regions), clusters (polling stations) and systematic steps (every k-th voter).
- A household spending survey can stratify by region and income group, so small groups are not missed by chance.
- Machine learning:
train_test_split(X, y, stratify=y)is stratified sampling on the labels, so a rare class keeps the same share in the train and test sets.
np.random.choice(data, n) samples with replacement, so a person can appear twice and the sample is not a simple random sample. Pass replace=False, and set a seed with np.random.default_rng(42) so the sample can be drawn again.Related
- Previous: Population and sample
- Next: Types of variables
- Reference: pandas DataFrame.sample
- Draw
rng.choice(len(ages), size=32)with replacement and count the different positions withlen(set(...)). How many of the 32 people are missing? - Stratify by classroom instead:
school.groupby("classroom").sample(n=4, random_state=42). Does every classroom appear exactly four times? - Change
size=2tosize=1in the cluster sample and rerun. How far does one classroom's mean fall from the school's?
This is what real progress feels like.