
Capturing NaN with an indicator column
An indicator column is a new column holding 1 where a value was missing and 0 where it was present, added before the gap is filled, so the model keeps the fact that the value was absent as well as a number to work with.
Last updated: 12 Oct, 2026 · pandas 3.0
Random sample imputation kept the shape of the column and lost the same thing median imputation lost: which rows were filled. This technique keeps it, and it is the answer whenever the gaps are not completely at random.
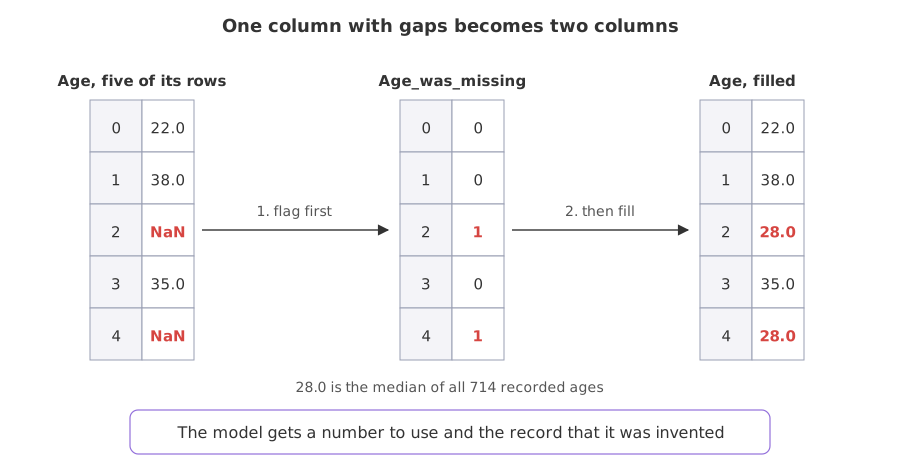
Syntax: np.where(condition, 1, 0) builds the flag from isnull(), and the fill follows. The order matters: build the flag first, because after the fill there is nothing left to flag.
# the flag first: after the fill, isnull() is False everywhere
df['Age_was_missing'] = np.where(df['Age'].isnull(), 1, 0)
df['Age'] = df['Age'].fillna(df['Age'].median())    # then fill
Loading the Titanic data
The Titanic table is 891 passengers. Age is missing for 177 of them, Cabin for 687 and Embarked for 2, which makes it the right table to learn these techniques on. It loads from its GitHub URL, so there is nothing to download. Run this block first, then the example under it.
import pandas as pd, numpy as np
import matplotlib
matplotlib.use('svg')
import matplotlib.pyplot as plt

url = ("https://raw.githubusercontent.com/krishnaik06/"
       "Feature-Engineering-Live-sessions/master/titanic.csv")
df = pd.read_csv(url, usecols=['Survived', 'Age', 'Fare'])
Building the flag, then filling the column
Two lines in that order give a frame with no missing ages and one extra column. Row 5 is the first passenger with no recorded age: its age reads 28.0, the median, and its flag reads 1.
df['Age_was_missing'] = np.where(df['Age'].isnull(), 1, 0)
df['Age'] = df['Age'].fillna(df['Age'].median())
print(df.head(7).to_string())
print()
print("rows flagged:", int(df['Age_was_missing'].sum()))
print("nulls left:", int(df['Age'].isnull().sum()))Survived Age Fare Age_was_missing 0 0 22.0 7.2500 0 1 1 38.0 71.2833 0 2 1 26.0 7.9250 0 3 1 35.0 53.1000 0 4 0 35.0 8.0500 0 5 0 28.0 8.4583 1 6 0 54.0 51.8625 0 rows flagged: 177 nulls left: 0
Showing that the flag carries something
The test is the one from Why values go missing: compare the target between the flagged rows and the rest. If the two differ, the column that was about to be thrown away predicts the thing you are modelling.
df['Age_was_missing'] = np.where(df['Age'].isnull(), 1, 0)
df['Age'] = df['Age'].fillna(df['Age'].median())
rates = df.groupby('Age_was_missing')['Survived'].mean()
rates.index = ['age recorded', 'age missing']
print(rates.round(4).to_string())
print("flag correlated with Survived:",
      round(df['Age_was_missing'].corr(df['Survived']), 6))
print("filled Age correlated with Survived:",
      round(df['Age'].corr(df['Survived']), 6))

fig, ax = plt.subplots(figsize=(6, 4))
rates.plot.bar(ax=ax, color=['#2e9e5b', '#d64541'], rot=0)
ax.set_ylabel('share who survived')
ax.set_title('Survival rate against a missing age')
fig.savefig('chart.svg')age recorded 0.4062 age missing 0.2938 flag correlated with Survived: -0.092197 filled Age correlated with Survived: -0.06491
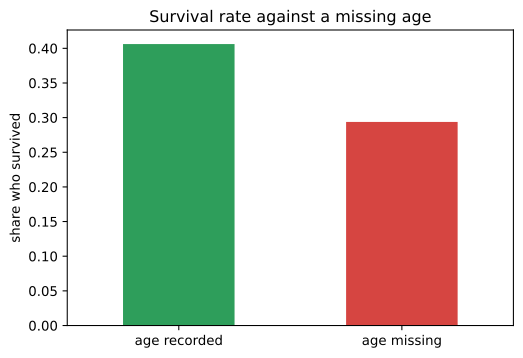
- 0.4062 against 0.2938. A passenger with no recorded age was about a third less likely to survive than one with an age.
- The flag correlates with the target at -0.092197. The filled Age column manages -0.064910, so the fact that an age was missing predicts survival more strongly than the age itself.
- 177 rows carry the flag. That is 19.87 percent of the table, enough for a model to learn from and small enough that the extra column costs little.
- Both columns go into the model. The point is not to choose between them.
The pattern people get half right
The technique has two halves and the second is easy to lose: build the flag, then still fill the original column. A frame left with the flag and the gaps is no better off, because the model cannot read NaN either way. The order matters as much: a flag built after the fill is a column of zeros, because nothing is missing any more.
# wrong: nothing is missing by the time the flag is built
df['Age'] = df['Age'].fillna(df['Age'].median())
df['Age_was_missing'] = np.where(df['Age'].isnull(), 1, 0)   # all zeros
Indicator plus fill vs filling alone
| Fill alone | Indicator plus fill | |
|---|---|---|
| Columns after | the same number | one more per filled column |
| Keeps the missingness signal | no | yes |
| Use when the gaps are | completely at random | related to anything else |
| Cost | none | one column each, which adds up over many columns |
| Done by scikit-learn with | SimpleImputer(strategy='median') | SimpleImputer(strategy='median', add_indicator=True) |
Where the indicator earns its column
- Any column where the gap might mean something. A blank income, an unreported symptom, a cabin number nobody wrote down.
- Columns with a large share missing. The more rows are filled, the more of the column is invention and the more the flag is worth.
- Before a model you cannot inspect. Give it both columns and let it decide, rather than deciding for it with a fill.
Related
- Previous: Random sample imputation
- Next: End of distribution imputation
- See also: SimpleImputer in scikit-learn
- Reference: MissingIndicator in the scikit-learn docs
- Build the flag after the fill and print its sum to see the column of zeros.
- Add a second indicator for
Fareand check whether it correlates withSurvivedat all. - Fill with the random sample technique instead of the median and check that the flag's correlation with the target does not move.
Little by little, you're building something great.