
Split first, then fit
Splitting first means calling train_test_split before any filling, scaling or encoding, so every number those steps learn comes from the training rows alone.
Last updated: 12 Oct, 2026 · pandas 3.0 · scikit-learn 1.9
Data leakage measured what happens when a transform sees the rows it will be scored on. This lesson is the fix, and the part of it that needs care: once you have split, each technique in this course has a clear answer to two questions. What does it learn from the training rows, and what does it do to the rest?
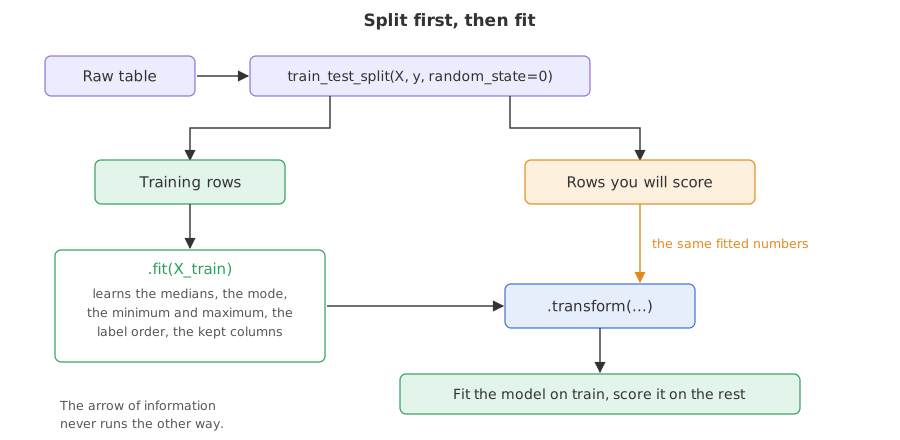
Syntax: train_test_split returns four frames in a fixed order, and every scikit-learn transform offers the same two methods.
X_train, X_test, y_train, y_test = train_test_split(
    X, y,
    test_size=0.3,       # the share of rows held back
    random_state=1,      # the same split on every run
    stratify=y)          # keep the class balance in both halves

step.fit(X_train)        # learns its numbers here, and only here
step.transform(X_test)   # applies those numbers, learns nothing
Why stratify matters for a classification target
stratify=y asks for the same share of each class in both halves. Without it a small class can land mostly on one side and the score swings with the seed. For a number target, leave it out.
X_train, X_test, y_train, y_test = train_test_split(
    X, y, test_size=0.3, random_state=1, stratify=y)
Learning the medians and the scale on the training half
SimpleImputer stores one number per column in statistics_. MinMaxScaler stores the smallest and largest value it saw. Both are fitted on X_train and then used on both halves.
imputer = SimpleImputer(strategy='median').fit(X_train)
scaler = MinMaxScaler().fit(imputer.transform(X_train))
Reading the numbers a fit has learned
import pandas as pd
from sklearn.impute import SimpleImputer
from sklearn.model_selection import train_test_split
from sklearn.preprocessing import MinMaxScaler

URL = ("https://raw.githubusercontent.com/krishnaik06/"
       "Feature-Engineering-Live-sessions/master/titanic.csv")
df = pd.read_csv(URL)
X = df[['Pclass', 'Age', 'Fare']]
y = df['Survived']

X_train, X_test, y_train, y_test = train_test_split(
    X, y, test_size=0.3, random_state=1, stratify=y)
print("train", X_train.shape, "test", X_test.shape)
print("survived in train:", round(y_train.mean(), 4),
      "in test:", round(y_test.mean(), 4))

imputer = SimpleImputer(strategy='median').fit(X_train)
print("medians learned on train:", imputer.statistics_)
print("medians of the whole frame:", X.median().to_numpy())

scaler = MinMaxScaler().fit(imputer.transform(X_train))
print("Age in train runs from", X_train['Age'].min(), "to", X_train['Age'].max())
test_scaled = scaler.transform(imputer.transform(X_test))
print("oldest passenger in test:", X_test['Age'].max(),
"-> scaled", round(float(test_scaled[:, 1].max()), 4))train (623, 3) test (268, 3) survived in train: 0.3836 in test: 0.3843 medians learned on train: [ 3. 28.5 14.4583] medians of the whole frame: [ 3. 28. 14.4542] Age in train runs from 0.42 to 74.0 oldest passenger in test: 80.0 -> scaled 1.0815
- The medians differ. The training half gives 28.5 for
Ageand 14.4583 forFare; the whole table gives 28.0 and 14.4542. The second pair is the one you are not allowed to use, and the difference is small here only because the split is large and random. - The class balance survived. 0.3836 against 0.3843 survivors, because
stratify=ydivided each class in the same proportion. - A test value went past 1. The oldest passenger in the training half is 74, the oldest in the test half is 80, and 80 scales to 1.0815. That is correct, not a bug. The scaler is a fixed formula learned on train, not a promise about rows it has never seen.
Seeing the test half fall outside the training range
import matplotlib
matplotlib.use('svg')
import matplotlib.pyplot as plt

imputer = SimpleImputer(strategy='median').fit(X_train)
scaler = MinMaxScaler().fit(imputer.transform(X_train))
tr = scaler.transform(imputer.transform(X_train))[:, 1]
te = scaler.transform(imputer.transform(X_test))[:, 1]
print("train scaled Age from", round(float(tr.min()), 4), "to", round(float(tr.max()), 4))
print("test  scaled Age from", round(float(te.min()), 4), "to", round(float(te.max()), 4))
print("test rows above 1:", int((te > 1).sum()))

fig, ax = plt.subplots(figsize=(7, 4))
ax.hist(tr, bins=30, color='#9370DB', alpha=0.75, label='train, the half the scaler saw')
ax.hist(te, bins=30, color='#e08a1e', alpha=0.75, label='test, scaled with the train numbers')
ax.axvline(1.0, color='#d64541', linestyle='--', linewidth=1.2)
ax.set_xlabel('Age after MinMaxScaler fitted on the training half')
ax.set_ylabel('passengers')
ax.set_title('A test value may fall outside 0 to 1, and that is correct')
ax.legend(fontsize=9)
fig.savefig('chart.svg')train scaled Age from 0.0 to 1.0 test scaled Age from 0.0045 to 1.0815 test rows above 1: 1
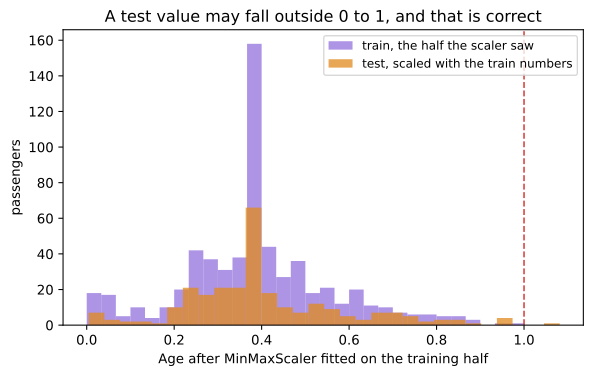
Both halves share a spike near 0.38. That is the median fill: 122 training passengers and 55 in the test half had no age recorded, and all 177 of them were given 28.5, which scales to 0.3816. An imputed column always has a bump where the fill value sits, and an extra 0 or 1 column recording which rows were filled is how you keep track of them.
Fitting a target guided code on the training half
The encoders that read the target need the same treatment, and they have one extra problem: a label the training half never saw. Here the first letter of Cabin becomes a deck, each deck gets a code ordered by the mean survival of the training passengers on it, and a deck outside that map has to be given an answer. Handling an unknown category covers the scikit-learn version of the same problem.
import pandas as pd
from sklearn.model_selection import train_test_split

URL = ("https://raw.githubusercontent.com/krishnaik06/"
       "Feature-Engineering-Live-sessions/master/titanic.csv")
df = pd.read_csv(URL)
df['Deck'] = df['Cabin'].fillna('Missing').str[0]
X = df[['Pclass', 'Age', 'Deck']]
y = df['Survived']
X_train, X_test, y_train, y_test = train_test_split(
    X, y, test_size=0.3, random_state=1, stratify=y)

# the order is learned from the training rows only
order = y_train.groupby(X_train['Deck']).mean().sort_values().index
code = {label: i for i, label in enumerate(order)}
print(code)

test_coded = X_test['Deck'].map(code)
print("test rows the map could not code:", int(test_coded.isnull().sum()))
print("a deck the training half never had:",
pd.Series(['Z']).map(code).fillna(-1).tolist()){'T': 0, 'M': 1, 'G': 2, 'A': 3, 'C': 4, 'F': 5, 'D': 6, 'B': 7, 'E': 8}
test rows the map could not code: 0
a deck the training half never had: [-1.0]- The map is nine decks wide and runs from the lowest training survival rate to the highest. Deck T, which one passenger occupies, gets 0, the
Missinggroup gets 1, and decks B and E, where most of their passengers lived, get 7 and 8. - Every test row happened to be codeable with this seed, which is luck, not safety. A different split puts deck T on the test side and the count stops being zero.
- An unknown label has to become something. Mapping a deck the training half never saw gives
NaN, and filling it with -1 marks it as outside the known set rather than pretending it belongs to one of them.
What fit on train means, technique by technique
Every technique in this course fits something. The table names it, so there is never a doubt about which half a number may come from.
| Technique | What fit learns from the training rows | What happens to the other rows |
|---|---|---|
| Mean or median imputation | one mean or median per column | the gaps are filled with that number |
| Frequent category imputation | the mode of each text column | the gaps get that label |
| Missing as its own category | nothing, the label is a constant | the same label is written |
| End of distribution imputation | mean plus three standard deviations | the gaps are filled with that value |
| Arbitrary value imputation | nothing, the value is your choice | the same value is written |
| Random sample imputation | the pool of observed training values | gaps are drawn from that pool with a seed |
| A missing indicator column | nothing, it reads each row on its own | the same 0 or 1 rule |
| Outlier fences, z score or IQR | the mean and standard deviation, or Q1, Q3 and the IQR | the same fences are applied, so a held back row can sit beyond them |
| One hot encoding | the list of labels, one column each | a known label lights its column, an unknown one lights none |
| Top N one hot encoding | which N labels are the most common | the same N columns, everything else all zeros |
| Ordinal encoding | the order you declared, which is not learned | the same mapping |
| Count or frequency encoding | the count of each label | the same counts, unknown labels fall back |
| Target guided ordinal and mean encoding | one code per label from the training target | the same codes, with a fallback for an unseen label |
| Rare label grouping | which labels clear the share threshold | everything else becomes one label |
| Log, reciprocal and square root | nothing, each is a fixed formula | the same formula |
| Box-Cox and Yeo-Johnson | the lambda that makes the training column most normal | the same lambda is applied |
| Standardisation | the mean and the standard deviation | subtract and divide by those |
| Min max scaling and RobustScaler | the minimum and maximum, or the median and the IQR | the same formula, so a value can land outside 0 to 1 |
| Variance threshold | which columns are constant in training | the same columns are dropped |
| Correlated feature removal | which pair is correlated in training | the same columns are dropped |
| Mutual information, chi square, Lasso selection | which columns score well on the training rows | the same columns are kept |
| SMOTE and under-sampling | the synthetic rows, from the training rows | nothing, the held back rows are never resampled |
Where splitting first changes your code
- A notebook that cleans at the top. Move
train_test_splitabove the first fill and the first scaler, and passrandom_stateso the split is the same tomorrow. - A model that will be served one row at a time. The fitted medians and codes have to live somewhere the serving code can reach, which is the argument for putting them in one object.
- A resampled training set. Resampling is a training-side operation. The held back rows keep their real class balance, or the score describes a world that does not exist.
fit_transform again on the test half silently refits it and throws the learned numbers away. On the test half, and on anything you serve, the only call is transform.Related
- Previous: Data leakage
- Next: ColumnTransformer
- See also: SimpleImputer in scikit-learn
- Reference: train_test_split in the scikit-learn documentation
- Remove
stratify=yand print the two survival rates again for a few values ofrandom_state. They drift apart. - Fit the
SimpleImputeronXinstead ofX_trainand comparestatistics_. That one change is the first door from the leakage lesson. - Print
scaler.data_min_andscaler.data_max_. Those two arrays are the whole memory of a fitted min max scaler.
This is what real progress feels like.