
Project: building the features
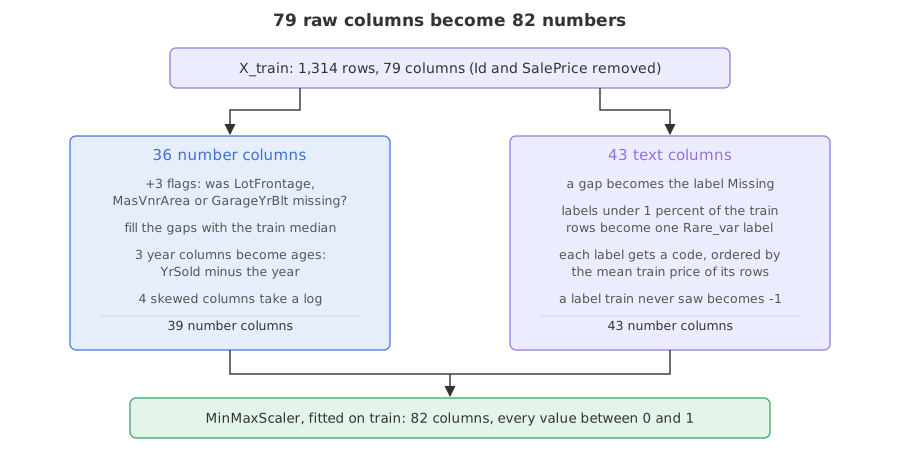
The feature pass turns 79 raw columns into 82 numbers between 0 and 1, with every value it fills, groups or codes taken from the 1,314 training houses.
Last updated: 12 Oct, 2026 · pandas 3.0 · scikit-learn 1.9
Project: the EDA pass ended with a table of decisions. This lesson carries them out, in an order that matters: a flag has to be written before the gap is filled, and a gap has to be filled before a year becomes an age.
Writing a flag before filling the gap
Three numeric columns have gaps. Filling them hides which rows were empty, and whether a house had its frontage recorded may itself carry information, so a 0 or 1 column is written first. The function reads one row at a time and learns nothing, which is why it can run on both halves.
NANCOLS = ['LotFrontage', 'MasVnrArea', 'GarageYrBlt']
YEARS = ['YearBuilt', 'YearRemodAdd', 'GarageYrBlt']
LOGS = ['LotFrontage', 'LotArea', '1stFlrSF', 'GrLivArea']def flags(frame):
frame = frame.copy()
for c in NANCOLS:
frame[c + 'nan'] = frame[c].isnull().astype(int)
return frameFilling with the training median
train[numbers].median() is one number per column, learned once. Both halves are filled with it. Writing a whole block of columns at once, train[numbers] = train[numbers].fillna(medians), assigns back into the frame; the in-place form through a single column does nothing under pandas 3, which Copy-on-write and chained assignment shows.
medians = train[numbers].median()
train[numbers] = train[numbers].fillna(medians)
test[numbers] = test[numbers].fillna(medians)Turning years into ages and taking logs
A year of construction is a label on a timeline; the age of the house at the sale is a quantity. Subtracting from YrSold turns one into the other. The four skewed measurements take a log at the same time. Both are fixed formulas, so they live in one function with no fitting in it.
def ages_and_logs(frame):
frame = frame.copy()
for c in YEARS:
frame[c] = frame['YrSold'] - frame[c]
for c in LOGS:
frame[c] = np.log(frame[c])
return frameGiving the gaps in text columns their own label
No pool, no alley and no fence are facts about the house, so the gap becomes the label Missing rather than the most common grade. Missing as its own category covers when that is the right call.
train, test = ages_and_logs(train), ages_and_logs(test)
train[words] = train[words].fillna('Missing')
test[words] = test[words].fillna('Missing')Grouping rare labels and coding by the training price
Any label held by fewer than one percent of the training houses joins one Rare_var group, which stops a label with four houses getting a code of its own. Then each surviving label gets an integer, ordered by the mean log price of the training houses that carry it, so the codes run from cheapest to dearest. A label that only the held back houses carry maps to nothing, and is coded -1.
codes = {}
for c in words:
share = train[c].value_counts(normalize=True)
keep = share[share > 0.01].index
train[c] = np.where(train[c].isin(keep), train[c], 'Rare_var')
test[c] = np.where(test[c].isin(keep), test[c], 'Rare_var')
order = y_train.groupby(train[c]).mean().sort_values().index
codes[c] = {label: i for i, label in enumerate(order)}
train[c] = train[c].map(codes[c]).astype(float)
test[c] = pd.Series(test[c], index=test.index).map(codes[c]).fillna(-1).astype(float)Scaling every column into the same range
MinMaxScaler is fitted on the training block and applied to both. set_output(transform='pandas') keeps the column names, so the result is still a frame you can read.
features = numbers + words
scaler = MinMaxScaler().set_output(transform='pandas').fit(train[features])
train_ready = scaler.transform(train[features])
test_ready = scaler.transform(test[features])Running the whole pass
import numpy as np
import pandas as pd
from sklearn.model_selection import train_test_split
from sklearn.preprocessing import MinMaxScaler
AMES = ("https://raw.githubusercontent.com/krishnaik06/"
"Advanced-House-Price-Prediction-/master/train.csv")
houses = pd.read_csv(AMES)
y = np.log(houses['SalePrice'])
X = houses.drop(columns=['Id', 'SalePrice'])
X_train, X_test, y_train, y_test = train_test_split(
X, y, test_size=0.1, random_state=0)
NANCOLS = ['LotFrontage', 'MasVnrArea', 'GarageYrBlt']
YEARS = ['YearBuilt', 'YearRemodAdd', 'GarageYrBlt']
LOGS = ['LotFrontage', 'LotArea', '1stFlrSF', 'GrLivArea']
def flags(frame):
    frame = frame.copy()
    for c in NANCOLS:
        frame[c + 'nan'] = frame[c].isnull().astype(int)
    return frame
def ages_and_logs(frame):
    frame = frame.copy()
    for c in YEARS:
        frame[c] = frame['YrSold'] - frame[c]
    for c in LOGS:
        frame[c] = np.log(frame[c])
    return frame
train, test = flags(X_train), flags(X_test)
numbers = [c for c in train.columns if pd.api.types.is_numeric_dtype(train[c])]
words = [c for c in train.columns if pd.api.types.is_string_dtype(train[c])]
print("numeric", len(numbers), "text", len(words),
"total", len(numbers) + len(words))
medians = train[numbers].median()
print("medians learned on train:", medians[NANCOLS].to_dict())
train[numbers] = train[numbers].fillna(medians)
test[numbers] = test[numbers].fillna(medians)
train, test = ages_and_logs(train), ages_and_logs(test)
train[words] = train[words].fillna('Missing')
test[words] = test[words].fillna('Missing')
codes = {}
for c in words:
    share = train[c].value_counts(normalize=True)
    keep = share[share > 0.01].index
    train[c] = np.where(train[c].isin(keep), train[c], 'Rare_var')
    test[c] = np.where(test[c].isin(keep), test[c], 'Rare_var')
    order = y_train.groupby(train[c]).mean().sort_values().index
    codes[c] = {label: i for i, label in enumerate(order)}
    train[c] = train[c].map(codes[c]).astype(float)
    test[c] = pd.Series(test[c], index=test.index).map(codes[c]).fillna(-1).astype(float)
features = numbers + words
scaler = MinMaxScaler().set_output(transform='pandas').fit(train[features])
train_ready = scaler.transform(train[features])
test_ready = scaler.transform(test[features])
print("MSZoning code:", codes['MSZoning'])
print("train", train_ready.shape, "test", test_ready.shape)
print("nulls left:", int(train_ready.isnull().sum().sum()),
int(test_ready.isnull().sum().sum()))
print(train_ready[['LotFrontage', 'YearBuilt', 'MSZoning',
'Neighborhood', 'LotFrontagenan']].head(3).round(4).to_string())numeric 39 text 43 total 82
medians learned on train: {'LotFrontage': 69.0, 'MasVnrArea': 0.0, 'GarageYrBlt': 1980.0}
MSZoning code: {'Rare_var': 0, 'RM': 1, 'RH': 2, 'RL': 3, 'FV': 4}
train (1314, 82) test (146, 82)
nulls left: 0 0
LotFrontage YearBuilt MSZoning Neighborhood LotFrontagenan
930 0.4612 0.0147 0.75 0.8636 0.0
656 0.4561 0.3603 0.75 0.3636 0.0
45 0.3947 0.0368 0.75 0.9545 0.0- 39 numbers and 43 coded text columns. The three flags are what take the numeric side from 36 to 39, and nothing is dropped, so the total is 82.
- The medians are the training ones. 69.0 feet of frontage, 0.0 square feet of masonry veneer and the year 1980 for a garage. Those three numbers now belong to the model and have to travel with it.
- MSZoning codes run 0 to 4 with Rare_var at 0. The rare group turned out to be the cheapest, and
RL, the common residential zone, sits at 3. - No nulls on either side. The test half is clean too, filled and coded with the training numbers, never with its own.
- The first three rows are all between 0 and 1.
LotFrontagenanis 0 for all three, so none of those houses was missing its frontage.
What each step learned, and from where
| Step | Learned from the training rows | Applied to the held back rows |
|---|---|---|
| flags | nothing, it reads one row at a time | the same rule |
| median fill | one median per numeric column | the same medians |
| ages and logs | nothing, both are formulas | the same formulas |
| Missing label | nothing, the label is a constant | the same label |
| rare grouping | which labels clear one percent | the same list, everything else grouped |
| target guided codes | one integer per label, ordered by the training price | the same codes, an unseen label becomes -1 |
| MinMaxScaler | the minimum and maximum of all 82 columns | the same formula, so a value may land outside 0 to 1 |
Where this pass is reused
- Any wide table with mixed types. The shape of this pass, flags then fills then formulas then codes then scale, transfers to almost any tabular problem.
- Any table where a gap means something. The flag plus the fill keeps both the value and the fact that it was missing, which one or the other alone throws away.
- Any model that needs comparable columns. Lasso, the model this project ends with, penalises coefficients, so a column measured in thousands would be punished for its units.
Rare_var no code at all, and taking the codes from the whole table instead of y_train is the second door in Data leakage, on a column the selection is about to rank highly.Related
- Previous: Project: the EDA pass
- Next: Project: the feature selection
- See also: Target guided ordinal encoding and Capturing NaN with an indicator column
- Reference: Preprocessing data in the scikit-learn documentation
- Change the rare threshold from
0.01to0.05and printcodes['Neighborhood']. Far more neighbourhoods collapse into one group. - Drop the three flag columns by emptying
NANCOLSand print the shape. 79 columns instead of 82, and the model loses the fact that a value was missing. - Print
test_ready.max()and count the columns above 1. Those are held back houses that went past the training maximum, which is what a fitted scaler is supposed to do.
This is what real progress feels like.