
Splitting a date into columns
A derived feature is a new column computed from one that a model cannot read, such as the three numbers day, month and year taken out of the text '24/03/2019'.
Last updated: 12 Oct, 2026 · pandas 3.0 · scikit-learn 1.9 · openpyxl 3.1
Box-Cox and Yeo-Johnson finished the work on columns that were already numbers. This part is about the columns that are not. The flight price dataset is nine of them in a row: a date, two times, a duration, a route and four categories, none of which a model can take as it stands.
Loading the two Excel files
The dataset ships as two .xlsx files, a training set with the price and a test set without it. pd.read_excel reads them, which needs the openpyxl package installed; pd.concat stacks them into one frame so every column is engineered once rather than twice.
import pandas as pd

BASE = ("https://raw.githubusercontent.com/krishnaik06/5-Days-Live-EDA-and-Featur"
        "e-Engineering/main/Flight%20Prediction/")
train = pd.read_excel(BASE + "Data_Train.xlsx")   # 10683 rows, Price included
test = pd.read_excel(BASE + "Test_set.xlsx")      # 2671 rows, no Price
flights = pd.concat([train, test], ignore_index=True)
ignore_index=True renumbers the rows 0 to 13353. Without it the test rows keep their own 0 to 2670, the frame holds two rows labelled 0, and a later drop(6474) would delete every row carrying that label.
Looking at the dataset
import pandas as pd

BASE = ("https://raw.githubusercontent.com/krishnaik06/5-Days-Live-EDA-and-Featur"
        "e-Engineering/main/Flight%20Prediction/")
train = pd.read_excel(BASE + "Data_Train.xlsx")   # 10683 rows, Price included
test = pd.read_excel(BASE + "Test_set.xlsx")      # 2671 rows, no Price
flights = pd.concat([train, test], ignore_index=True)

print("train", train.shape, " test", test.shape, " together", flights.shape)
print(flights.dtypes.to_string())
print("\nnulls:", flights.isnull().sum()[lambda s: s > 0].to_dict())train (10683, 11) test (2671, 10) together (13354, 11)
Airline str
Date_of_Journey str
Source str
Destination str
Route str
Dep_Time str
Arrival_Time str
Duration str
Total_Stops str
Additional_Info str
Price float64
nulls: {'Route': 1, 'Total_Stops': 1, 'Price': 2671}- Ten of the eleven columns are text. Only
Pricearrives as a number, and it is the target, not an input. - The test rows have no Price, so
pd.concatfills those 2671 values with NaN. That is how to tell the two halves apart later. - Route and Total_Stops each have one null, and it is the same row.
Splitting the date string with .str
Date_of_Journey holds values such as 24/03/2019 and 1/05/2019. The day is everything before the first slash, the month is between the slashes and the year is after the second one.
Splitting one text column into a list
.str is the accessor that applies a Python string method to every value in a Series. .str.split('/') turns each value into a list of pieces, and .str[0] takes the first piece of each list.
day = flights['Date_of_Journey'].str.split('/').str[0]      # '24', '1', '9'
month = flights['Date_of_Journey'].str.split('/').str[1]    # '03', '05', '06'
year = flights['Date_of_Journey'].str.split('/').str[2]     # '2019' for every row
Casting the pieces to integers
Each piece is still text, so '1' and '01' are different values and nothing can be compared or subtracted. astype(int) makes them numbers.
flights['Date'] = flights['Date_of_Journey'].str.split('/').str[0].astype(int)
flights['Month'] = flights['Date_of_Journey'].str.split('/').str[1].astype(int)
flights['Year'] = flights['Date_of_Journey'].str.split('/').str[2].astype(int)
Dropping the column the pieces came from
Once the three numbers exist, the text column carries nothing new and would have to be encoded as 13354 separate categories. It goes.
flights = flights.drop(columns='Date_of_Journey')Turning one date column into three
day = flights['Date_of_Journey'].str.split('/')
print("the split pieces:", day.head(3).tolist())

flights['Date'] = day.str[0].astype(int)
flights['Month'] = day.str[1].astype(int)
flights['Year'] = day.str[2].astype(int)
flights = flights.drop(columns='Date_of_Journey')

print(flights[['Date', 'Month', 'Year']].head(3).to_string())
print("\ndtypes:", flights[["Date", "Month", "Year"]].dtypes.tolist())
print("Year values:", flights["Year"].unique().tolist())
print("Month values:", sorted(flights["Month"].unique().tolist()))the split pieces: [['24', '03', '2019'], ['1', '05', '2019'], ['9', '06', '2019']]
Date Month Year
0 24 3 2019
1 1 5 2019
2 9 6 2019
dtypes: [dtype('int64'), dtype('int64'), dtype('int64')]
Year values: [2019]
Month values: [3, 4, 5, 6]- The split pieces are lists such as
['24', '03', '2019'], one per row, which is why a second.str[i]is needed to reach inside them. - All three columns are
int64after the cast. Before it they were text, and'1'would never have equalled1. - Year holds only 2019. A column with one value tells a model nothing and is the first thing the feature selection part throws away.
- Month runs from 3 to 6. The data covers four months, so a month number is a usable feature here and would not be across several years.
The same split with to_datetime
The video splits the string because the split is what it is teaching. pandas also has a date type, and converting to it first gives the same three numbers plus everything else a date knows: the weekday, the week of the year, whether it is a weekend. The page shows both because the .str technique is needed for the time and duration columns, where no date type helps.
# format='%d/%m/%Y' says day first, then month, then year, separated by slashes
when = pd.to_datetime(flights['Date_of_Journey'], format='%d/%m/%Y')
flights['Date'] = when.dt.day
flights['Month'] = when.dt.month
flights['Weekday'] = when.dt.weekday # Monday is 0, Sunday is 6import matplotlib.pyplot as plt
when = pd.to_datetime(flights['Date_of_Journey'], format='%d/%m/%Y')
by_split = flights['Date_of_Journey'].str.split('/').str[0].astype(int)
print("to_datetime agrees with the split:", bool((when.dt.day == by_split).all()))
print("first three dates :", when.head(3).dt.strftime("%Y-%m-%d").tolist())
print("weekday names :", when.dt.day_name().head(3).tolist())
print("flights per weekday:", when.dt.day_name().value_counts().to_dict())
per_month = when.dt.month.value_counts().sort_index()
fig, ax = plt.subplots(figsize=(6.5, 3.4))
ax.bar(per_month.index, per_month.values, color='#3a6fd8')
ax.set_xticks(per_month.index)
ax.set_xticklabels(['March', 'April', 'May', 'June'])
ax.set_ylabel('flights'); ax.set_title('Flights per month of journey')
fig.tight_layout()to_datetime agrees with the split: True
first three dates : ['2019-03-24', '2019-05-01', '2019-06-09']
weekday names : ['Sunday', 'Wednesday', 'Sunday']
flights per weekday: {'Wednesday': 2621, 'Monday': 2307, 'Thursday': 2283, 'Saturday': 2097, 'Sunday': 1849, 'Friday': 1121, 'Tuesday': 1076}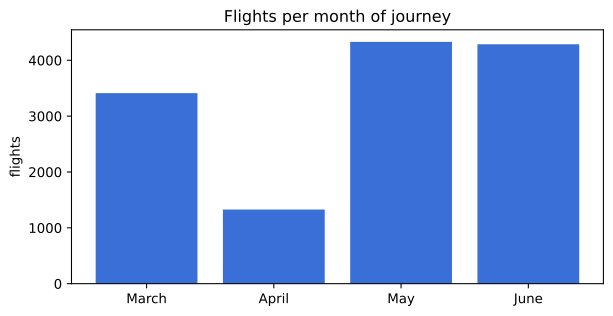
- The two routes agree on every row, so nothing is lost by using the date type.
day_name()is free once the column is a date, and it is a real feature: fares differ between a Wednesday and a Sunday. The split can never produce it.- The four months are uneven. April has far fewer flights than the other three, which is worth knowing before a model reads Month as a number.
Splitting the text compared with converting to a date
.str.split | pd.to_datetime | |
|---|---|---|
| Gives | exactly the pieces you ask for | day, month, year, weekday, quarter, week, and more |
| Needs | nothing, it is string work | a format string, or the parsing is slow and can guess wrong |
| Catches a bad value | no, it produces a wrong piece in silence | yes, it raises unless errors='coerce' |
| Works on | any text pattern, including a duration | dates and times only |
| Use it for | a column no date type understands | a column that holds a date |
Where a derived date feature is used
- Price and demand models. Day of the month, month and weekday all move an air fare, and the raw date string moves nothing.
- Anything with a seasonal pattern, such as retail sales, where the month is the feature that carries Diwali or Christmas.
- Age style features. Subtracting a date from today gives the age of a customer, a car or an account, which is usually stronger than the date itself.
pd.to_datetime without a format argument has to guess, and on a column holding 1/05/2019 it may read the first number as a month. Pass the format whenever you know it. The same applies to dayfirst=True, which is a hint rather than a guarantee.Related
- Previous: Box-Cox and Yeo-Johnson
- Next: Turning a time into hours and minutes
- See also: Dropping constant features
- Reference: Working with text data in the pandas docs
- Add
flights['IsWeekend'] = when.dt.weekday >= 5and count how many flights fall on a weekend. - Drop the
formatargument frompd.to_datetimeand compare the first three dates with the ones above. - Build
Datewith.apply(lambda x: x.split('/')[0])instead of.str.splitand time both with%%timeit.
Slow is fine. Stopping is the only problem.