
Why values go missing
Why a value is missing has three standard answers, MCAR, MAR and MNAR, and which one holds decides whether a missing value can be filled in and forgotten or has to be recorded as a fact of its own.
Last updated: 12 Oct, 2026 · pandas 3.0
Relationships between features finished the charting pass. Every technique from here on changes the data, and the first of them fills the gaps. Before choosing how to fill a column, work out why it is empty.
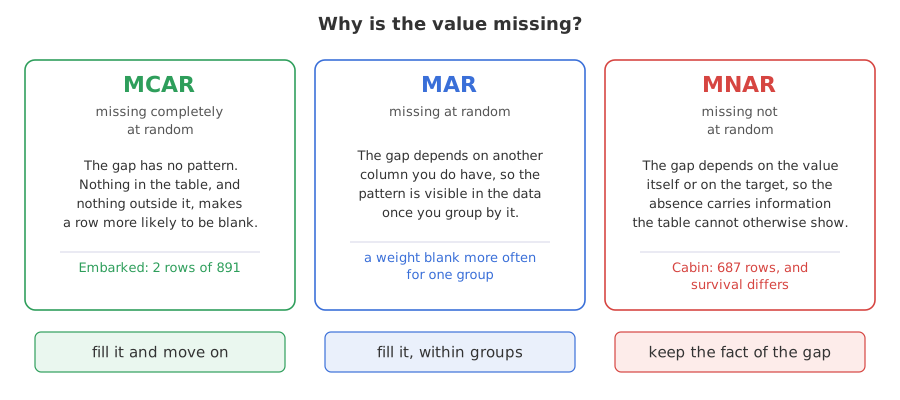
The three mechanisms
- MCAR, missing completely at random. The chance of a value being absent has nothing to do with any column, present or absent. A form page was lost, a sensor dropped a reading. The rows that are missing look like the rows that are not.
- MAR, missing at random. The chance depends on another column you do have. If older passengers were asked their age less often, Age is missing at random given Pclass or Survived, and the pattern is visible in your data.
- MNAR, missing not at random. The chance depends on the missing value itself, or on the target. High earners refuse to state their income; a cabin number is recorded for the passengers who came back. The reason is outside the table, and the absence carries information.
Loading the Titanic data
The Titanic table is 891 passengers. Age is missing for 177 of them, Cabin for 687 and Embarked for 2, which makes it the right table to learn these techniques on. It loads from its GitHub URL, so there is nothing to download. Run this block first, then the example under it.
import pandas as pd, numpy as np
import matplotlib
matplotlib.use('svg')
import matplotlib.pyplot as plt

url = ("https://raw.githubusercontent.com/krishnaik06/"
       "Feature-Engineering-Live-sessions/master/titanic.csv")
df = pd.read_csv(url)
Counting what is missing, and in which columns
isnull() gives a frame of True and False the same shape as the data. Summing it counts the missing values per column, and taking the mean gives the share, because True counts as 1. Both are the first two lines of any missing value pass.
nulls = df.isnull().sum()
print(nulls[nulls > 0].to_string())
print()
print("share missing, in percent:")
print((df.isnull().mean()[lambda s: s > 0] * 100).round(2).to_string())Age 177 Cabin 687 Embarked 2 share missing, in percent: Age 19.87 Cabin 77.10 Embarked 0.22
Looking at the rows that are missing
A count says how many; the rows themselves say what kind. Two passengers have no Embarked value, and printing those two rows is the whole investigation.
print(df[df['Embarked'].isnull()][['Name', 'Pclass', 'Fare', 'Cabin', 'Ticket']]
.to_string())Name Pclass Fare Cabin Ticket 61 Icard, Miss. Amelie 1 80.0 B28 113572 829 Stone, Mrs. George Nelson (Martha Evelyn) 1 80.0 B28 113572
- Both are first class, both paid 80.0, both are in cabin B28. They share ticket 113572, so they travelled together.
- Nothing about them explains the gap. They are not unusual passengers, their fare is recorded, their cabin is recorded. This is what MCAR looks like: two rows lost for no reason the table can show.
- Two rows out of 891 is 0.22 percent. At that size, how you fill them barely matters, and dropping them is reasonable.
Testing whether missingness depends on the target
MNAR cannot be proved from the data alone, but it can be caught. Build a column that is 1 where the value is missing and 0 where it is present, then compare the target between the two groups. If the groups differ, the absence is carrying information and filling the column quietly throws that information away.
# 1 where the cabin number is missing, 0 where it is recorded
df['cabin_missing'] = np.where(df['Cabin'].isnull(), 1, 0)
df['cabin_missing'].mean()                  # the share of rows with no cabin
df.groupby('cabin_missing')['Survived'].mean() # survival in each groupdf['cabin_missing'] = np.where(df['Cabin'].isnull(), 1, 0)
rates = df.groupby('cabin_missing')['Survived'].mean()
rates.index = ['cabin recorded', 'cabin missing']
print(rates.round(4).to_string())
print("everyone:", round(df['Survived'].mean(), 4))
print("rows with no cabin:", int(df['cabin_missing'].sum()), "of", len(df))
fig, ax = plt.subplots(figsize=(6, 4))
rates.plot.bar(ax=ax, color=['#2e9e5b', '#d64541'], rot=0)
ax.axhline(df['Survived'].mean(), color='#333333', linestyle='--')
ax.set_ylabel('share who survived')
ax.set_title('Survival rate against a missing cabin number')
fig.savefig('chart.svg')cabin recorded 0.6667 cabin missing 0.2999 everyone: 0.3838 rows with no cabin: 687 of 891
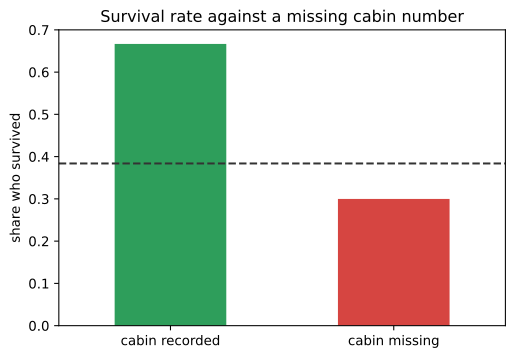
What the two bars prove
- Two thirds of the passengers with a recorded cabin survived; three in ten of the others did. 0.6667 against 0.2999, with the overall rate of 0.3838 between them.
- 687 of 891 cabin numbers are missing, which is 77.10 percent of the column.
- That is not MCAR. Under MCAR the two bars would sit at the same height, because the missing rows would be an ordinary sample of the data.
- The absence is a feature. A column that is 1 when the cabin is missing predicts survival better than most of the columns in the table.
The same test on Age is the subject of Capturing NaN with an indicator column, which keeps the finding as a column instead of losing it.
What each mechanism allows
| Mechanism | How to recognise it | What is safe |
|---|---|---|
| MCAR | the missing rows look like the rest; no column predicts the gap | mean, median or random sample imputation; dropping the rows when there are few |
| MAR | another column predicts the gap | imputation within groups, or any imputation plus an indicator column |
| MNAR | the target differs between present and missing | an indicator column, a category of its own, or end of distribution imputation |
| Any of them, in practice | you rarely know for certain | keep an indicator and let the model decide |
Where this question changes the answer
- Choosing between filling and flagging. MCAR columns can be filled and forgotten; MNAR columns need the fact of the gap kept.
- Deciding whether to drop rows. Dropping MCAR rows loses sample size; dropping MNAR rows removes a group from the data and biases everything after it.
- Explaining a model. A feature built from a gap is often strong and always needs an explanation, which the mechanism provides.
dropna() on a frame removes every row with a missing value in any column, not only in the one you were looking at. On this table len(df.dropna()) is 183 of 891 rows, because Cabin is missing for most passengers. Subset it, df.dropna(subset=['Embarked']), or check len before and after.Related
- Previous: Relationships between features
- Next: Mean and median imputation
- See also: The missing value map
- Reference: Imputation of missing values in the scikit-learn user guide
- Run the same indicator test on
Ageand compare the two survival rates with the cabin ones. - Print
len(df.dropna())and see how many of the 891 rows survive a blanketdropna(). - Group
cabin_missingbyPclassand read which class is missing its cabin numbers.
Slow is fine. Stopping is the only problem.