
When to drop a feature instead of engineering it
A column is dropped rather than engineered when another column already carries its signal in fewer values, which is the case for Route against Total_Stops.
Last updated: 12 Oct, 2026 · pandas 3.0 · scikit-learn 1.9 · openpyxl 3.1
Turning a duration string into minutes rescued a column that looked unusable. Not every column is worth rescuing. Route holds values such as BLR → DEL and CCU → IXR → BBI → BLR, and the question is what it would cost and what it would add.
Counting what the column would cost
A text column has to become numbers, and the cheapest honest encoding gives one column per level minus one. That number is the first thing to look at.
import pandas as pd

BASE = ("https://raw.githubusercontent.com/krishnaik06/5-Days-Live-EDA-and-Featur"
        "e-Engineering/main/Flight%20Prediction/")
train = pd.read_excel(BASE + "Data_Train.xlsx")   # 10683 rows, Price included
test = pd.read_excel(BASE + "Test_set.xlsx")      # 2671 rows, no Price
flights = pd.concat([train, test], ignore_index=True)print(flights['Route'].nunique()) # how many distinct routes
print(flights['Total_Stops'].unique()) # the levels of the other candidateRoute and Total_Stops side by side
print("Route levels      :", flights['Route'].nunique())
print("Total_Stops levels:", flights['Total_Stops'].nunique())
print("Total_Stops values:", flights['Total_Stops'].unique().tolist())

print("\nthe single null row:")
missing = flights[flights['Total_Stops'].isnull()]
print(missing[['Airline', 'Source', 'Destination', 'Route', 'Total_Stops']].to_string())

print("\nfour busiest routes:")
print(flights['Route'].value_counts().head(4).to_string())Route levels : 132
Total_Stops levels: 5
Total_Stops values: ['non-stop', '2 stops', '1 stop', '3 stops', nan, '4 stops']
the single null row:
Airline Source Destination Route Total_Stops
9039 Air India Delhi Cochin NaN NaN
four busiest routes:
Route
DEL → BOM → COK 3000
BLR → DEL 1941
CCU → BOM → BLR 1232
CCU → BLR 896- Route has 132 levels and Total_Stops has 5. One hot encoding Route adds 131 columns to a table of eleven; Total_Stops adds none at all, because its levels are ordered and one number holds them.
- The same row is null in both. An Air India flight from Delhi to Cochin with no route recorded, which is why neither column can fill the other here.
- The four busiest routes cover 7069 of the 13354 rows, more than half, so most of those 131 columns would be almost entirely zero.
Checking whether Route adds anything new
A route written as CCU → IXR → BBI → BLR has three arrows and two stops. If that holds for every row, Route contains Total_Stops and the only extra it carries is which airports were passed through.
arrows = flights['Route'].str.count('→')      # 1 arrow for a direct flight
order = {'non-stop': 0, '1 stop': 1, '2 stops': 2, '3 stops': 3, '4 stops': 4}
stops = flights['Total_Stops'].map(order)
print((arrows - 1 == stops).sum()) # rows where the two agreearrows = flights['Route'].str.count('→')
order = {'non-stop': 0, '1 stop': 1, '2 stops': 2, '3 stops': 3, '4 stops': 4}
stops = flights['Total_Stops'].map(order)
agree = (arrows - 1 == stops)
print("rows where the arrow count equals Total_Stops:", int(agree.sum()),
"of", int(stops.notna().sum()))
flights['Total_Stops'] = stops.fillna(1).astype('int64')
flights = flights.drop(columns='Route')
print("\nstop counts:")
print(flights['Total_Stops'].value_counts().sort_index().to_string())
print("\ncolumns now:", flights.shape[1])rows where the arrow count equals Total_Stops: 13353 of 13353 stop counts: Total_Stops 0 4340 1 7057 2 1899 3 56 4 2 columns now: 10
- All 13353 rows with a value agree. The arrow count is Total_Stops, every time, so the ordered column loses nothing that the route encodes about connections.
- The one null is filled with 1. Delhi to Cochin has no direct service in this data, so the flight had at least one stop, and 1 is the most common value anyway.
.mapturns the five labels into 0 to 4, which is ordinal encoding: the numbers are in the right order, so a model reading 3 as more than 1 is reading it correctly.- Four stops happens twice in 13354 rows. A level that rare is worth remembering when a split puts all of them on one side.
What Route would have added
Dropping it is a decision, not a law. Which airports a flight passes through can move a price: a connection through a busy hub is priced differently from one through a small airport. The honest summary is that Route costs 131 columns and adds one piece of information beyond the stop count, and that trade is worth revisiting once a first model exists.
import matplotlib.pyplot as plt

order = {'non-stop': 0, '1 stop': 1, '2 stops': 2, '3 stops': 3, '4 stops': 4}
priced = flights[flights['Price'].notna()].copy()
priced['stops'] = priced['Total_Stops'].map(order)
by_stops = priced.groupby('stops')['Price'].median()
print(by_stops.round(1).to_string())

fig, ax = plt.subplots(figsize=(6.5, 3.4))
ax.bar(by_stops.index, by_stops.values, color='#3a6fd8')
ax.set_xticks(by_stops.index)
ax.set_xlabel('number of stops'); ax.set_ylabel('median price')
ax.set_title('Median fare by number of stops')
fig.tight_layout()stops 0.0 4667.0 1.0 10262.0 2.0 12760.0 3.0 12954.0 4.0 17686.0
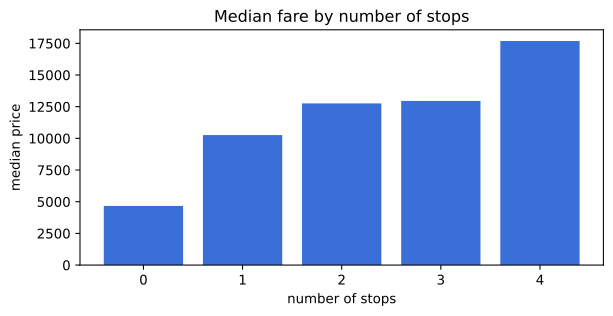
The median fare rises with every extra stop, so the one column that replaced Route is carrying a real and ordered signal. That is what makes the drop safe.
Keeping a column compared with dropping it
| Ask | Keep it when | Drop it when |
|---|---|---|
| How many levels? | few, or ordered | hundreds, each one rare |
| Is it already in another column? | no | yes, as Route is in Total_Stops |
| Does it move the target? | yes, measurably | no, or you cannot tell |
| What does encoding cost? | one or a few columns | a column per level, mostly zeros |
| Can it be reduced? | yes, group the rare levels | not without losing the point of it |
Where this decision comes up
- Identifier columns. A booking reference or a user id has one level per row. It cannot generalise and it goes.
- Free text with a tidy sibling. A full address next to a postcode, a job title next to a grade: keep the one with fewer levels unless the text is the point.
- High cardinality categories you want to keep. When a column carries something no other column has, group the rare levels instead of dropping it, which One hot encoding with many categories covers.
.map.Related
- Previous: Turning a duration string into minutes
- Next: Cyclical encoding for hours and weekdays
- See also: Why features are dropped
- Reference: Series.map in the pandas docs
- Drop the
orderdictionary's'4 stops'entry and count the nulls afterwards. Two rows go missing without a word. - One hot encode Route with
pd.get_dummies(flights['Route'], dtype=int)and look at.shapeand at how many columns sum to less than 10. - Keep only the origin airport of each route with
flights['Route'].str.split(' → ').str[0]and count its levels. There are five, and they are the five valuesSourcealready holds.
Little by little, you're building something great.