
What an outlier is
An outlier is a value in a column that sits far away from the rest of that column, far enough that the summaries you compute and the model you fit come out different because of it.
Last updated: 12 Oct, 2026 · pandas 3.0 · scikit-learn 1.9
The missing-value part filled the holes in a column. A column can also carry the opposite problem: a value that is present, is a number, and is either wrong by a mile or true and rare. SimpleImputer in scikit-learn left every row in place, which is where this part starts.
Measuring what one far value costs
A column of 34 sensor readings
These are 34 readings of the same thing. Most of them sit between 10 and 19. Three of them do not.
readings = [11, 10, 12, 14, 12, 15, 14, 13, 15, 102, 12, 14, 17, 19, 107,
            10, 13, 12, 14, 12, 108, 12, 11, 14, 13, 15, 10, 15, 12, 10, 14, 13, 15, 10]
The same column with the three far values removed
A boolean mask keeps the rows whose value is under 50. That cut-off was chosen by eye, which is the reason the next two lessons exist: the z score and the IQR fence replace the eye with a rule.
clean = s[s < 50] # the same column, three values shortReading the column twice
The mean, the median and the standard deviation of the full column, then of the 31 values that are left.
import pandas as pd

readings = [11, 10, 12, 14, 12, 15, 14, 13, 15, 102, 12, 14, 17, 19, 107,
            10, 13, 12, 14, 12, 108, 12, 11, 14, 13, 15, 10, 15, 12, 10, 14, 13, 15, 10]
s = pd.Series(readings)
clean = s[s < 50]     # the same column, three values short

print("all 34  :  mean", round(s.mean(), 2), " median", s.median(),
      " std", round(s.std(), 2))
print("other 31:  mean", round(clean.mean(), 2), " median", clean.median(),
      " std", round(clean.std(), 2))
print("largest of the other 31:", clean.max())all 34 : mean 21.18 median 13.0 std 26.77 other 31: mean 13.0 median 13.0 std 2.14 largest of the other 31: 19
What the two rows show
- The mean moved from 21.18 to 13.0. Three values out of 34 dragged the average of the column 63% above where the other 31 readings sit.
- The median did not move. It was 13.0 both times. The median is a position in the sorted column, so how far away a value sits changes nothing as long as it stays on the same side.
- The standard deviation went from 26.77 to 2.14. The spread of the column, as the number most models use, was more than twelve times too large.
- The largest of the other 31 is 19. So 102, 107 and 108 are not slightly high. They are five times the typical reading.
No error was raised. Both columns are valid numbers and pandas computed both answers correctly. That is what makes an outlier a reading problem rather than a crash.
Plotting the 34 readings on one line
One dot per reading on a single axis. The shape of the problem is easier to see than to describe.
import matplotlib
matplotlib.use("svg")
import matplotlib.pyplot as plt
import numpy as np

readings = [11, 10, 12, 14, 12, 15, 14, 13, 15, 102, 12, 14, 17, 19, 107,
            10, 13, 12, 14, 12, 108, 12, 11, 14, 13, 15, 10, 15, 12, 10, 14, 13, 15, 10]
values = np.array(readings)
position = np.arange(1, len(values) + 1)   # where each reading sits in the list
far = values >= 50

fig, ax = plt.subplots(figsize=(7, 2.8))
ax.scatter(values[~far], position[~far], s=45, color="#3a6fd8", label="the other 31")
ax.scatter(values[far], position[far], s=45, color="#d64541", label="far from the rest")
ax.set_xlabel("reading")
ax.set_ylabel("position in the column")
ax.legend(loc="center")
fig.savefig("chart.svg")

print("near:", int((~far).sum()), " far:", int(far.sum()))near: 31 far: 3
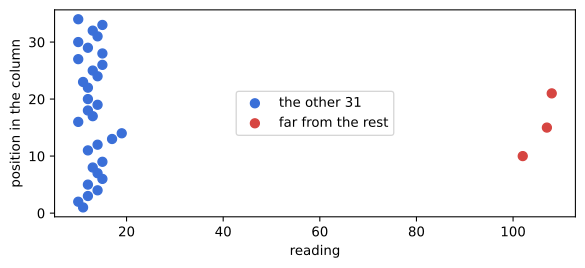
The gap between 19 and 102 is the thing every detection rule in this part is trying to put a number on.
Which models a far value moves
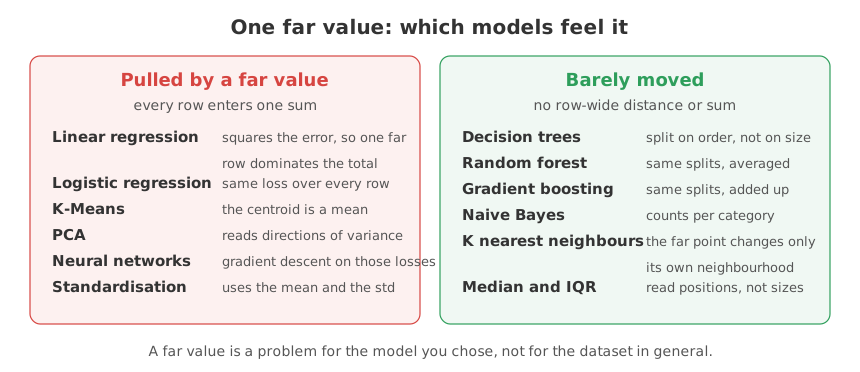
A far value is a problem for the model you chose, not for the dataset in general. Anything that adds every row into one total feels it. Anything that reads order or counts does not.
An outlier, an error and a rare truth
| What it is | Example | What to do with it | |
|---|---|---|---|
| Data error | a value that was never true | an age of 300, a price of -1 | fix it, or treat it as missing |
| Rare truth | a real value from the tail of the column | a fare of 512 on the Titanic | keep it, and pick a model that tolerates it |
| Another population | a row that belongs to a different group | a wholesale order in a retail table | model it separately, or add a flag column |
| Noise | ordinary scatter, not far from the rest | a reading of 19 among readings of 10 to 15 | leave it alone |
The first three look identical in a box plot. A chart finds the candidates; what a candidate is comes from knowing where the data came from.
Where a far value changes the answer
- Before computing a mean to fill holes. Mean imputation on the 34 readings would write 21.18 into every gap, a value larger than 31 of the 34 readings that exist.
- Before scaling. Standardisation divides by the standard deviation, so the 26.77 above would squash the real variation of the column into almost nothing.
- Before fitting a linear or logistic model. Both add a loss over every row, so a row far from the rest contributes most of the total and most of the gradient.
Related
- Previous: SimpleImputer in scikit-learn
- Next: Finding outliers with the z score
- See also: Mean and median imputation
- Reference: pandas.Series.describe
- Change the cut-off in
s[s < 50]to 20 and read the three numbers again. Nothing moves, because no reading sits between 19 and 102. - Add one more reading of 500 to the list and print the mean and the median again. One of the two moves a long way and the other does not.
- Replace the three far values with 16, 17 and 18 and print the standard deviation. Compare it with the 2.14 of the other 31.
You understood something today that you didn't yesterday.