
Random sample imputation
Random sample imputation fills each missing value with a value drawn at random from the same column's recorded values, so the filled column keeps the shape and the spread the original had.
Last updated: 12 Oct, 2026 · pandas 3.0
Mean and median imputation filled 177 ages with one number and the standard deviation fell from 14.526497 to 13.019697. Drawing 177 different numbers from the column itself is the fix, and it takes three lines, one of which is the trick.
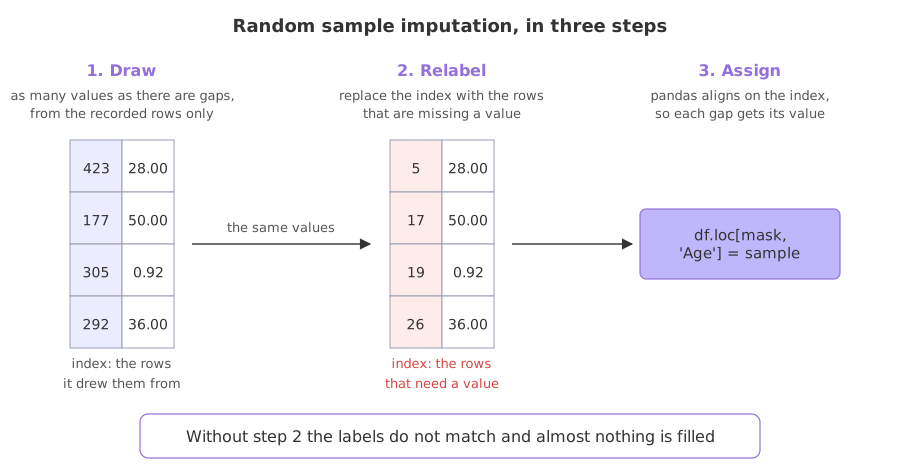
Syntax: Series.dropna().sample(n, random_state=0) draws n recorded values, sample.index = ... relabels them with the rows that need filling, and df.loc[mask, 'col'] = sample writes them in. random_state is what makes the result the same on every run.
missing = df['Age'].isnull().sum()               # how many gaps to fill
pool = df['Age'].dropna()                        # draw only from real values
sample = pool.sample(missing, random_state=0)    # a Series of 177 ages
sample.index = df[df['Age'].isnull()].index      # relabel: pandas aligns on index
df.loc[df['Age'].isnull(), 'Age'] = sample       # one drawn value per gap
Loading the Titanic data
The Titanic table is 891 passengers. Age is missing for 177 of them, Cabin for 687 and Embarked for 2, which makes it the right table to learn these techniques on. It loads from its GitHub URL, so there is nothing to download. Run this block first, then the example under it.
import pandas as pd
import matplotlib
matplotlib.use('svg')
import matplotlib.pyplot as plt

url = ("https://raw.githubusercontent.com/krishnaik06/"
       "Feature-Engineering-Live-sessions/master/titanic.csv")
df = pd.read_csv(url, usecols=['Survived', 'Age', 'Fare'])
Why the index has to be replaced
sample() returns the drawn rows with their own index, the positions it took them from. Assigning that Series into other rows would align on those labels and fill almost nothing. Overwriting the index with the labels of the rows that are missing is what lines the two up, and it is the step that is easy to leave out.
missing = int(df['Age'].isnull().sum())
sample = df['Age'].dropna().sample(missing, random_state=0)
print("values drawn:", len(sample))
print(sample.head(4).to_string())
print("rows that need one:", df[df['Age'].isnull()].index[:4].tolist())

sample.index = df[df['Age'].isnull()].index
print("after relabelling:")
print(sample.head(4).to_string())values drawn: 177 423 28.00 177 50.00 305 0.92 292 36.00 rows that need one: [5, 17, 19, 26] after relabelling: 5 28.00 17 50.00 19 0.92 26 36.00
- 177 values are drawn, one per gap.
dropna()first means the pool holds no NaN, so a gap can never be filled with another gap. - The drawn values carry labels 423, 177, 305 and 292. Those are the passengers the values came from, not the passengers that need filling.
- After the relabel the same values carry 5, 17, 19 and 26, which are the first four rows with no age. The values did not change; only their labels did.
- Without the relabel the fill silently misses. Only the few rows whose labels appear in both would receive a value.
Keeping the shape the column had
Drawing from the column's own values means the filled rows follow the same distribution as the recorded ones. The standard deviation barely moves, and a density curve of the result sits on top of the original.
df['Age_median'] = df['Age'].fillna(df['Age'].median())
sample = df['Age'].dropna().sample(int(df['Age'].isnull().sum()), random_state=0)
sample.index = df[df['Age'].isnull()].index
df['Age_random'] = df['Age']
df.loc[df['Age'].isnull(), 'Age_random'] = sample
print(df[['Age', 'Age_median', 'Age_random']].std().round(6).to_string())

fig, ax = plt.subplots(figsize=(7, 4))
df['Age'].plot(kind='kde', ax=ax, label='Age, the 714 recorded')
df['Age_median'].plot(kind='kde', ax=ax, color='red', label='median imputation')
df['Age_random'].plot(kind='kde', ax=ax, color='green',
                      label='random sample imputation')
ax.set_xlabel('Age')
ax.legend()
ax.set_title('Three curves: original, median filled, random sample filled')
fig.savefig('chart.svg')Age 14.526497 Age_median 13.019697 Age_random 14.563654
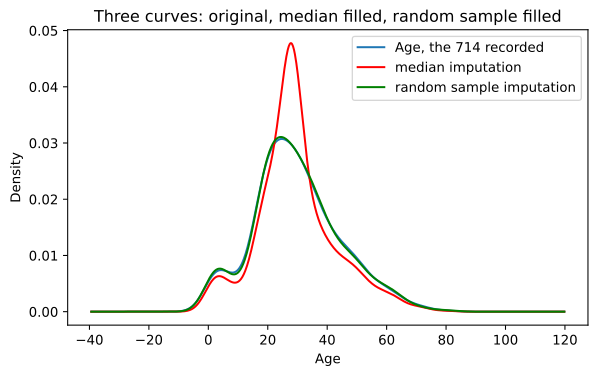
Reading the three standard deviations
- 14.526497 before, 14.563654 after random sample imputation. The spread is kept; the small rise is the randomness of a 177 value draw.
- 13.019697 after median imputation. Filling with one number cost about 10 percent of the spread, and this technique costs none of it.
- The green curve hides the blue one. Nothing downstream that reads the shape of this column can tell that 177 values were invented.
- Which is also the weakness. Nothing records which rows were filled, so a model cannot learn from the fact that an age was absent.
Random sample vs median imputation
| Median imputation | Random sample imputation | |
|---|---|---|
| Fill value | one number for every gap | a different drawn value per gap |
| Spread after the fill | shrinks | kept |
| Shape after the fill | a spike at the fill value | unchanged |
| Reproducible | yes, always | only with random_state |
| Needs the column to have | enough values for a median | enough values to draw from |
| Keeps the missingness signal | no | no, unless you add an indicator |
Where random sample imputation is worth the extra lines
- A column whose distribution matters downstream. Anything that will be transformed, binned or used to fit a distribution.
- A column with a large share missing where the shape must survive. One fill value over 20 percent of a column leaves a spike that no later step can undo.
- Alongside an indicator column. The pair keeps both the distribution and the fact that a value was absent, which Capturing NaN with an indicator column covers.
random_state every run fills different values, so a model trained today cannot be reproduced tomorrow, and a difference in its score could be the fill rather than the change you made. Pass the seed, and never rely on a global np.random.seed, which any extra cell can disturb.Related
- Previous: Mean and median imputation
- Next: Capturing NaN with an indicator column
- See also: Why values go missing
- Reference: Series.sample in the pandas docs
- Change
random_state=0torandom_state=1and read how far the standard deviation moves. - Remove the
sample.index = ...line and count how many nulls are left after the assignment. - Drop the
dropna()from the pool and check whether any gap is filled with a NaN.
Every expert started right here.