
Mean encoding
Mean encoding replaces each category with the mean of the target inside it, keeping the size of the difference between levels where a rank keeps only their order.
Last updated: 12 Oct, 2026 · pandas 3.0 · scikit-learn 1.9
Target guided ordinal encoding ranked the cabin blocks 0 to 8. Mean encoding writes 0.7576 rather than 8, which is more information and a larger version of the same problem.
The clip defines it against the ranked version, names the monotonic relationship it creates with the target, and ends on the overfitting it invites.
The clip stops at naming the problem. The rest of this lesson measures it and fixes it.
Syntax: the same groupby, kept as values rather than ranks.
means = df.groupby(column)[target].mean().to_dict()
df[column + "_mean"] = df[column].map(means)
Mean encoding the cabin column
import pandas as pd

URL = ("https://raw.githubusercontent.com/krishnaik06/Feature-Engineering-Live-sessions/"
       "master/titanic.csv")
df = pd.read_csv(URL, usecols=["Cabin", "Survived"])
df["Cabin"] = df["Cabin"].fillna("Missing").str[0]

means = df.groupby("Cabin")["Survived"].mean()
ranks = {name: i for i, name in enumerate(means.sort_values().index)}

table = pd.DataFrame({"rows": df["Cabin"].value_counts(),
                      "mean": means.round(6),
                      "rank": pd.Series(ranks)})
print(table.sort_values("rank").to_string())
print("overall survival rate:", round(df["Survived"].mean(), 6))rows mean rank T 1 0.000000 0 M 687 0.299854 1 A 15 0.466667 2 G 4 0.500000 3 C 59 0.593220 4 F 13 0.615385 5 B 47 0.744681 6 E 32 0.750000 7 D 33 0.757576 8 overall survival rate: 0.383838
What the mean keeps that the rank throws away
- B, E and D are ranks 6, 7 and 8 and means 0.7447, 0.75 and 0.7576. The ranks say the three levels are one step apart. The means say they are almost the same.
- M is rank 1 and mean 0.2999. The gap from M to the next level is 0.167 in mean terms and one step in rank terms, the same step as between B and E.
- T is rank 0 and mean 0.0, from a single row. The mean makes the weak evidence look stronger, because 0.0 is further from everything else than rank 0 is.
- The overall survival rate is 0.3838. Six of the nine levels sit above it and two below it, which is the whole signal the column carries.
Measuring the overfitting on a column that shows it
Cabin has nine levels, most of them with dozens of rows, so the damage is hard to see. Ticket is the same dataset's worst case: 681 distinct values across 891 rows, 547 of which appear exactly once. A level with one row has a group mean equal to that row's own target.
import pandas as pd

URL = ("https://raw.githubusercontent.com/krishnaik06/Feature-Engineering-Live-sessions/"
       "master/titanic.csv")
df = pd.read_csv(URL, usecols=["Ticket", "Survived"])

means = df.groupby("Ticket")["Survived"].mean()
encoded = df["Ticket"].map(means)

print("distinct tickets:", df["Ticket"].nunique(), "in", len(df), "rows")
print("tickets held by one passenger:",
      int((df["Ticket"].value_counts() == 1).sum()))
print("correlation of the new column with Survived:",
      round(encoded.corr(df["Survived"]), 4))
print("rows where the new column equals the target exactly:",
int((encoded == df["Survived"]).sum()), "of", len(df))distinct tickets: 681 in 891 rows tickets held by one passenger: 547 correlation of the new column with Survived: 0.9275 rows where the new column equals the target exactly: 764 of 891
Why 0.9275 is a warning and not a result
- The new column correlates 0.9275 with the target. No real feature of a Titanic passenger predicts survival that well. A number like this one on a freshly built feature is a reason to check how it was built.
- 764 of 891 rows got their own target back. For a ticket held by one passenger, the group mean is that passenger's survival, so the feature is a copy of the answer.
- A model fitted on this scores beautifully and learns nothing. At prediction time a new ticket number has no group, so the column is NaN or a fallback, and the only feature the model trusted is gone.
- The same mechanism works on every target-based encoder. The ranks of the previous lesson and the probability ratios of the same family all read the target of the row they are written onto.
Computing the encoding out of fold
The cure is to make sure no row's code was computed from that row. The data is split into folds, and the code written onto a row comes from the other folds only. A row then cannot see its own target, and a level that appears once has no other row to learn from, so it falls back to the overall mean, which is what it deserves.
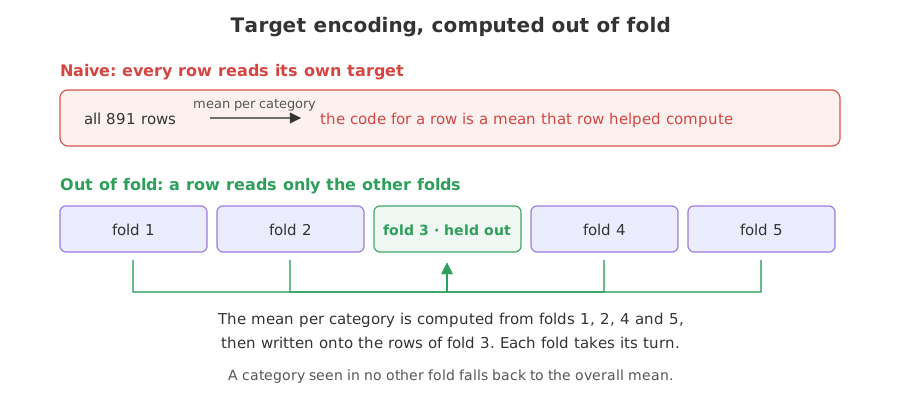
TargetEncoder does this. Its fit_transform is deliberately not the same as fit followed by transform: fit_transform cross-fits for the training rows, while transform uses the means from the whole training set, which is correct for rows the encoding was not fitted on.
encoder = TargetEncoder(cv=StratifiedKFold(5, shuffle=True, random_state=0))
train_codes = encoder.fit_transform(X_train, y_train)   # cross-fitted
test_codes = encoder.transform(X_test)                  # plain means
The same column, encoded out of fold
import matplotlib
matplotlib.use("svg")
import matplotlib.pyplot as plt
import pandas as pd
from sklearn.model_selection import StratifiedKFold
from sklearn.preprocessing import TargetEncoder

URL = ("https://raw.githubusercontent.com/krishnaik06/Feature-Engineering-Live-sessions/"
       "master/titanic.csv")
df = pd.read_csv(URL, usecols=["Ticket", "Survived"])
y = df["Survived"]

naive = df["Ticket"].map(df.groupby("Ticket")["Survived"].mean())
encoder = TargetEncoder(cv=StratifiedKFold(5, shuffle=True, random_state=0))
out_of_fold = encoder.fit_transform(df[["Ticket"]], y)[:, 0]

print("naive        correlation with Survived:", round(naive.corr(y), 4))
print("out of fold  correlation with Survived:",
      round(pd.Series(out_of_fold).corr(y), 4))
print("overall survival rate the encoder falls back to:",
      round(encoder.target_mean_, 6))

fig, axes = plt.subplots(1, 2, figsize=(8, 2.8), sharey=True)
axes[0].hist(naive, bins=20, color="#d64541")
axes[0].set_title("naive mean encoding")
axes[1].hist(out_of_fold, bins=20, color="#2e9e5b")
axes[1].set_title("out of fold")
for ax in axes:
    ax.set_xlabel("encoded value")
axes[0].set_ylabel("rows")
fig.savefig("chart.svg")naive correlation with Survived: 0.9275 out of fold correlation with Survived: 0.3434 overall survival rate the encoder falls back to: 0.383838
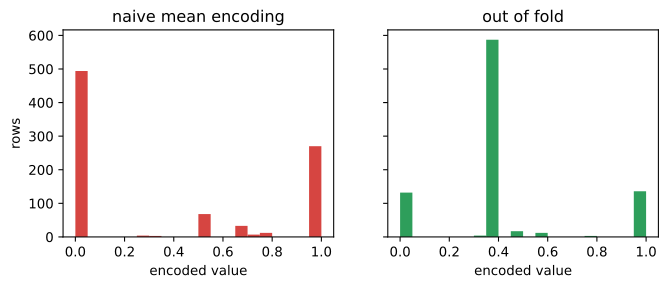
What cross-fitting changed
- The correlation fell from 0.9275 to 0.3434. That is what the column is worth once it can no longer read the answer, and 0.3434 is a respectable feature.
- The naive histogram is two spikes at 0 and 1. One spike per outcome, because a ticket held by one passenger returns that passenger's survival and no other fact.
- The out-of-fold histogram piles up at 0.3838. That is the overall survival rate, which the encoder writes for a level it saw in no other fold.
- The fallback is the honest answer. A ticket number seen once tells you nothing beyond the base rate, and the encoder now says so instead of claiming certainty.
Naive mean encoding vs TargetEncoder
| groupby mean and map | TargetEncoder | |
|---|---|---|
| Code for a training row | a mean that row helped compute | a mean from the other folds |
| Ticket correlation with the target | 0.9275 | 0.3434 |
| A level with one row | its own target, 0 or 1 | the overall mean |
| A level seen for the first time later | NaN | the overall mean |
| Smoothing towards the overall mean | none | yes, by level size |
| Fits in a Pipeline | no | yes |
TargetEncoder handles regression and multiclass targets as well, and it has no drop or sparse options because it always returns one column per feature. Pass the cross-validation object through cv=: the older random_state and shuffle arguments are on their way out.
Where a target encoding is worth the care
- A high cardinality column feeding gradient boosting. One numeric column in place of hundreds of indicators, which is the usual reason this encoder is reached for at all.
- A column whose level means differ by a wide margin. Merchant against fraud rate, postcode against default rate. Where the means are all close to the overall mean, the column is not carrying a signal and the encoding adds nothing.
- Inside a pipeline with a split. The encoder fits on the training fold and transforms the test fold, which is what Pipelines and pandas output is for.
Related
- Previous: Target guided ordinal encoding
- Next: Handling an unknown category
- See also: Data leakage
- Reference: sklearn.preprocessing.TargetEncoder
- Run the same comparison on the Cabin column and see how much smaller the gap between the two correlations is.
- Change
StratifiedKFold(5, ...)toStratifiedKFold(2, ...)and read the out-of-fold correlation again. - Call
encoder.transform(df[["Ticket"]])after fitting and compare the first ten values with thefit_transformones.
Slow is fine. Stopping is the only problem.