
Answering a question with groupby
groupby splits a frame into one group per distinct value of the columns you name, and the method you call after it says what to work out inside each group, so one line answers a question that spans two columns.
Last updated: 12 Oct, 2026 · pandas 3.0 · seaborn 0.13 · matplotlib 3.11
Pie and bar charts with a top-N trim counted one column at a time. Most questions name two: a rating band and its colour, a city and whether it has online delivery. That is what groupby is for.
Syntax: df.groupby(['a', 'b']) returns a GroupBy object, which holds the split but has computed nothing. .size() counts the rows per group, .reset_index() turns the result back into a frame, and .rename(columns={0: 'name'}) names the counted column.
grouped = df.groupby(['Rating text', 'Rating color'])   # no work done yet
counts = grouped.size()                 # rows per group, a Series
frame = counts.reset_index()            # back to a frame, count in column 0
frame = frame.rename(columns={0: 'Rating Count'})       # name that column
df.groupby('Rating text')['Aggregate rating'].agg(['min', 'max'])   # other summaries
Loading the Zomato data
Every example here starts from the merged Zomato frame. The zip recipe is the one Reading a CSV that is not UTF-8 built, and the join on the country code is the one Merging a lookup table built. Run this block first, then the example under it.
import io, zipfile, urllib.request
import pandas as pd
import matplotlib
matplotlib.use('svg')
import matplotlib.pyplot as plt

url = ("https://raw.githubusercontent.com/krishnaik06/"
       "5-Days-Live-EDA-and-Feature-Engineering/main/Zomatodataset.zip")
zf = zipfile.ZipFile(io.BytesIO(urllib.request.urlopen(url).read()))
with zf.open('zomato.csv') as fh:
    df = pd.read_csv(fh, encoding='latin-1')
with zf.open('Country-Code.xlsx') as fh:
    codes = pd.read_excel(fh)
df = pd.merge(df, codes, on='Country Code', how='left')
Counting rows per group, then getting a frame back
The question: which rating colour goes with which rating band, and how many restaurants are in each pair? Grouping on both columns and counting answers it in one line. size() returns a Series with a two level index, which prints awkwardly and is hard to chart, so reset_index() flattens it into a frame with three columns.
grouped = df.groupby(['Rating text', 'Rating color'])
print("type before any summary:", type(grouped).__name__)

ratings = grouped.size().reset_index().rename(columns={0: 'Rating Count'})
print(ratings.to_string(index=False))
print("rows in the result:", len(ratings))type before any summary: DataFrameGroupBy
Rating text Rating color Rating Count
Average Orange 3737
Excellent Dark Green 301
Good Yellow 2100
Not rated White 2148
Poor Red 186
Very Good Green 1079
rows in the result: 6What the six groups say
- Each band has exactly one colour. Six bands, six colours, six rows: the two columns carry the same information twice, which is worth knowing before either is used as a feature.
- The counts match the single column count. Average 3,737 and Not rated 2,148 are the numbers One chart, one question, one observation charted, which is the check that the grouping did what you meant.
- The GroupBy object computed nothing on its own. Printing it gives a
DataFrameGroupBy, not numbers. The summary method is what runs the work.
Summarising a number inside each group
size() counts rows. Naming a column after the grouping and calling agg works out several summaries of that column per group instead. This is how the rating bands get their actual boundaries, rather than guessing them from the band names.
bands = (df.groupby('Rating text')['Aggregate rating']
           .agg(['min', 'max', 'size'])
           .sort_values('min'))
print(bands.to_string())min max size Rating text Not rated 0.0 0.0 2148 Poor 1.8 2.4 186 Average 2.5 3.4 3737 Good 3.5 3.9 2100 Very Good 4.0 4.4 1079 Excellent 4.5 4.9 301
- The bands are fixed ranges. Poor is 1.8 to 2.4, Average 2.5 to 3.4, Good 3.5 to 3.9, Very Good 4.0 to 4.4 and Excellent 4.5 to 4.9.
- Not rated is a single value, 0.0. Its minimum and maximum agree, so those 2,148 rows are not restaurants rated zero; they are restaurants with no rating, stored as a zero.
- That zero would distort an average. Those 2,148 rows hold a 0.0 that means no rating, so any mean of
Aggregate ratingtaken over the whole column is pulled down by them.
Answering a question about two columns
The question: which countries have restaurants that take online orders? Selecting the two columns, grouping on both and counting gives one row per country and answer pair. Keeping the rows where the answer is Yes is the last step.
answer = (df[['Country', 'Has Online delivery']]
          .groupby(['Country', 'Has Online delivery'])
          .size()
          .reset_index()
          .rename(columns={0: 'restaurants'}))
print(answer[answer['Has Online delivery'] == 'Yes'].to_string(index=False))
print("countries in the table:", df['Country'].nunique())Country Has Online delivery restaurants
India Yes 2423
UAE Yes 28
countries in the table: 15Two countries out of fifteen: India with 2,423 restaurants and UAE with 28. The other thirteen have no row with Yes at all, which is the kind of answer a chart of one column could not have given.
Charting a two column group count
unstack() turns the second level of the group index into columns, which is exactly the shape a grouped bar chart needs: one row per city, one column per answer. fill_value=0 puts a zero where a pair has no rows.
top = df['City'].value_counts().head(5).index
delivery = (df[df['City'].isin(top)]
            .groupby(['City', 'Has Online delivery'])
            .size()
            .unstack(fill_value=0))
print(delivery.to_string())
print()
print("percent of each city's restaurants that deliver:")
print((delivery['Yes'] / delivery.sum(axis=1) * 100).round(1).to_string())

fig, ax = plt.subplots(figsize=(7, 4))
delivery.loc[top].plot.bar(ax=ax, color=['#d64541', '#2e9e5b'])
ax.set_ylabel('restaurants')
ax.set_title('Online delivery in the five busiest cities')
fig.savefig('chart.svg')Has Online delivery No Yes City Faridabad 216 35 Ghaziabad 15 10 Gurgaon 693 425 New Delhi 3984 1489 Noida 716 364 percent of each city's restaurants that deliver: City Faridabad 13.9 Ghaziabad 40.0 Gurgaon 38.0 New Delhi 27.2 Noida 33.7
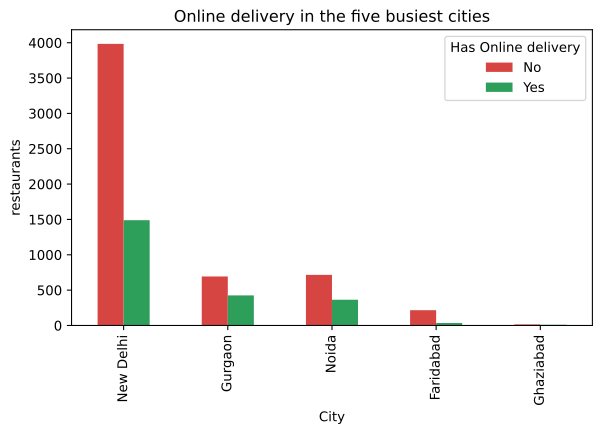
- Gurgaon and Noida deliver most readily, 38.0 and 33.7 percent of their restaurants, against 27.2 percent in New Delhi.
- Ghaziabad has 25 restaurants in total. Its 40.0 percent is ten restaurants, so the share is not comparable with New Delhi's.
- Counts and shares answer different questions. New Delhi has by far the most delivering restaurants and the lowest share of them.
size vs count vs value_counts
| Call | Counts | Returns |
|---|---|---|
groupby(c).size() | rows per group, missing values included | a Series indexed by the group |
groupby(c).count() | non-missing values per column, per group | a frame, one column per remaining column |
df[c].value_counts() | rows per value of one column, NaN dropped | a Series sorted by count |
groupby(c)[n].agg([...]) | any summary of column n inside each group | a frame, one column per summary |
Where groupby answers the question directly
- Any question with the word per in it. Sales per region, rating per city, missing values per band.
- Testing whether missingness depends on something else. Grouping by the target and averaging a missing value flag is the test in Why values go missing.
- Building an encoding. Ranking categories by the mean of the target inside each group is the whole of Target guided ordinal encoding.
groupby drops rows whose grouping value is missing. A count built on a column with nulls therefore adds up to less than len(df) and no warning says so. Pass dropna=False to keep the missing group, and check the total against len(df).Related
- Previous: Pie and bar charts with a top-N trim
- Next: Count plots and bar plots in seaborn
- See also: Why values go missing
- Reference: DataFrame.groupby in the pandas docs
- Swap
size()forcount()in the first example and read why the result has more columns. - Group
CountryandCurrencytogether and find the two countries that share a currency name. - Add
dropna=Falseto a groupby onCuisinesand find the group of nine rows it brings back.
This is what real progress feels like.