
SimpleImputer in scikit-learn
SimpleImputer is a scikit-learn transformer that learns a fill value per column when it is fitted and applies it when it transforms, which is the same arithmetic as the pandas techniques with the fill value remembered as part of a fitted object.
Last updated: 12 Oct, 2026 · pandas 3.0 · scikit-learn 1.9
Every technique up to Missing as its own category computed its fill value and applied it in the same line. That is fine in a notebook and wrong the moment there is a test set, because the test rows must be filled with the values learned from the training rows.
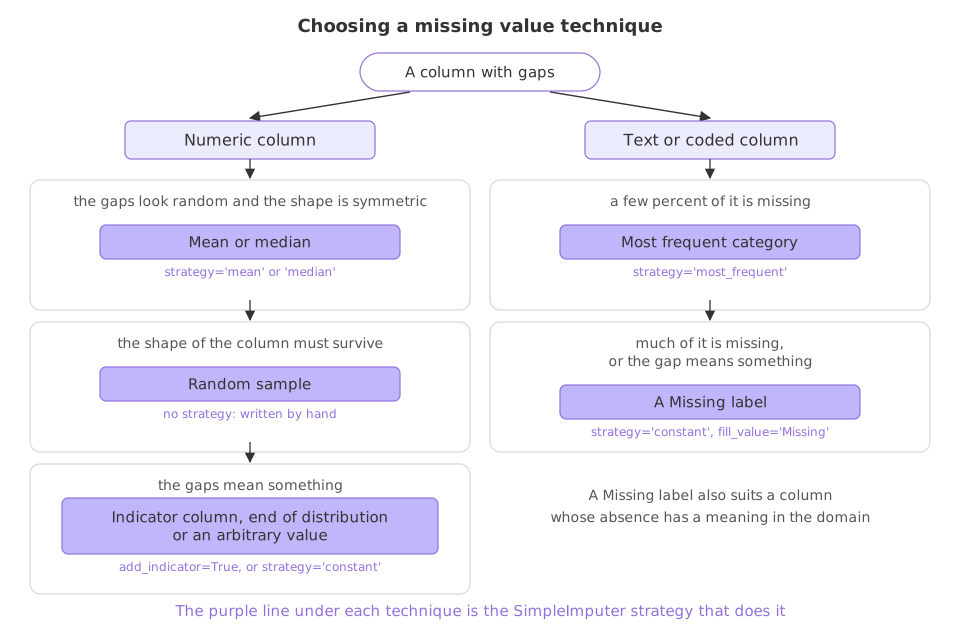
Syntax: SimpleImputer(strategy=...) takes 'mean', 'median', 'most_frequent' or 'constant' with a fill_value. fit learns the values, transform applies them, statistics_ holds what was learned, and add_indicator=True appends the flag column.
imputer = SimpleImputer(strategy='median')
imputer.fit(X_train[['Age']])         # learn 28.0 from the training rows only
imputer.transform(X_test[['Age']])    # fill the test rows with that same 28.0
imputer.statistics_                   # the learned fill value per column
SimpleImputer(strategy='constant', fill_value='Missing')   # the text version
Setting up scikit-learn and the data
set_config(transform_output='pandas') makes every scikit-learn transformer return a DataFrame with column names instead of a bare numpy array, which removes the usual pd.DataFrame(result, columns=...) wrapping. Run this block first, then the example under it.
import pandas as pd
from sklearn.impute import SimpleImputer
from sklearn import set_config

set_config(transform_output='pandas')     # transformers return frames, not arrays
url = ("https://raw.githubusercontent.com/krishnaik06/"
       "Feature-Engineering-Live-sessions/master/titanic.csv")
df = pd.read_csv(url, usecols=['Age', 'Fare', 'Embarked', 'Cabin'])
Learning the fill value and reading it back
Fitting on two numeric columns learns two medians, and statistics_ prints them. They are the same numbers the pandas techniques computed, which is the point: nothing new is being calculated, it is being remembered.
num = SimpleImputer(strategy='median')
filled = num.fit_transform(df[['Age', 'Fare']])
print("learned fill values:", num.statistics_)
print("nulls before:", df[['Age', 'Fare']].isnull().sum().to_dict())
print("nulls after: ", filled.isnull().sum().to_dict())
print(type(filled).__name__, "with columns", list(filled.columns))learned fill values: [28. 14.4542]
nulls before: {'Age': 177, 'Fare': 0}
nulls after: {'Age': 0, 'Fare': 0}
DataFrame with columns ['Age', 'Fare']- The learned values are 28.0 and 14.4542. The first is the Age median that Mean and median imputation filled with by hand; the second is the Fare median.
- 177 nulls become 0. Fare had none to begin with, and the imputer still learned a fill value for it, ready for a test set that does have one.
- The result is a DataFrame. That is
set_config(transform_output='pandas')at work; without it the same call returns a numpy array with no column names. - The fill value lives in the object.
numcan now be applied to any frame with those two columns, which is what makes it safe across a split.
The strategies for a text column
'most_frequent' is frequent category imputation and 'constant' with a fill_value is the Missing label, the two techniques the categorical lessons did by hand. Both work on text columns, where mean and median would raise.
cat = SimpleImputer(strategy='most_frequent')
embarked = cat.fit_transform(df[['Embarked']])
print("most frequent port:", cat.statistics_)
print("nulls left:", int(embarked['Embarked'].isnull().sum()))

const = SimpleImputer(strategy='constant', fill_value='Missing')
cabin = const.fit_transform(df[['Cabin']])
print(cabin['Cabin'].value_counts().head(3).to_string())most frequent port: ['S'] nulls left: 0 Cabin Missing 687 G6 4 C23 C25 C27 4
The port of embarkation is filled with S, which is the mode of that column, and the 687 missing cabins become the label Missing, which is now the largest level by a distance. The next largest levels are two real cabins, each shared by four passengers.
Keeping the indicator in the same call
add_indicator=True appends one extra column per input column that had a gap, named missingindicator_<column>. It is the technique from Capturing NaN with an indicator column without the two lines of numpy, and the flag is built before the fill, in the right order, by the transformer.
both = SimpleImputer(strategy='median', add_indicator=True)
out = both.fit_transform(df[['Age']])
print("columns out:", list(out.columns))
print(out.head(7).to_string())
print("rows flagged:", int(out['missingindicator_Age'].sum()))columns out: ['Age', 'missingindicator_Age']
Age missingindicator_Age
0 22.0 0.0
1 38.0 0.0
2 26.0 0.0
3 35.0 0.0
4 35.0 0.0
5 28.0 1.0
6 54.0 0.0
rows flagged: 177Row 5 reads 28.0 with its indicator at 1.0, which is the same pair of values the hand written version produced. The indicator comes back as a float because the output is one numeric block.
SimpleImputer vs fillna
fillna | SimpleImputer | |
|---|---|---|
| Where the fill value lives | in a variable you manage | inside the fitted object |
| Across a train and test split | you must remember to reuse the training value | fit on train, transform on test |
| Works inside a Pipeline | no | yes |
| Strategies | anything you can compute | mean, median, most_frequent, constant |
| Indicator column | two lines of numpy | add_indicator=True |
| Random sample imputation | yes, by hand | no, it is not a strategy |
| Returns | a Series | a frame with transform_output='pandas', otherwise an array |
Where SimpleImputer belongs
- Any model that will meet new data. The fill value has to come from the training rows, and a fitted transformer is what carries it.
- Inside a ColumnTransformer. Numeric columns take the median strategy and text columns the constant one, in one object, which is what ColumnTransformer assembles.
- As one step of a pipeline. Imputer, encoder, scaler and model fitted together on the training fold only, which is the shape Pipelines and pandas output builds.
fit_transform on the whole dataset before splitting defeats the point: the median then comes from the test rows as well as the training ones. Split first, call fit_transform on the training part and transform on the test part, which is what Split first, then fit covers.Related
- Previous: Missing as its own category
- Next: What an outlier is
- See also: Pipelines and pandas output
- Reference: SimpleImputer and Imputation of missing values
- Change
strategy='median'to'mean'and read whatstatistics_prints. - Remove the
set_configline and check what typefit_transformreturns. - Fit an imputer on the first 600 rows and transform the last 291, then compare
statistics_with the median of the whole column.
Little by little, you're building something great.