
Standardisation
Standardisation rewrites a column as z = (x − mean) / standard deviation, so the column ends with a mean of 0 and a standard deviation of 1.
Last updated: 12 Oct, 2026 · pandas 3.0 · scikit-learn 1.9 · scipy 1.18
Which algorithms need scaling named the models that change when the columns do. This is the first of the three scalers, and the one to reach for by default. It is also called the z score, the same quantity statistics uses to ask how many standard deviations a value sits from the mean.
Syntax: fit learns the mean and the standard deviation of each column, transform applies them, and fit_transform does both in one call.
from sklearn.preprocessing import StandardScaler

scaler = StandardScaler()
out = scaler.fit_transform(df)   # a numpy array, one column per input column
Loading four Titanic columns
The video uses four numeric columns and fills the 177 missing ages with the median first, because a scaler has nothing to do with a NaN and will carry it straight through.
import pandas as pd

URL = "https://raw.githubusercontent.com/krishnaik06/Feature-Engineering-Live-sessions/master/titanic.csv"
df = pd.read_csv(URL, usecols=['Survived', 'Pclass', 'Age', 'Fare'])
df['Age'] = df['Age'].fillna(df['Age'].median())   # 177 missing ages, filled with 28.0
Asking for a DataFrame back
Plain fit_transform returns a numpy array, which has no column names and no head(). set_output(transform='pandas') asks scikit-learn for a DataFrame with the original column names instead.
from sklearn.preprocessing import StandardScaler

scaler = StandardScaler().set_output(transform='pandas')
scaled = scaler.fit_transform(df)
Standardising the four columns
from sklearn.preprocessing import StandardScaler

scaler = StandardScaler().set_output(transform='pandas')
scaled = scaler.fit_transform(df)

print(scaled.head(3).round(6).to_string())
print("\ncolumn means:", scaled.mean().round(10).tolist())
print("column stds :", scaled.std(ddof=0).round(10).tolist())
print("\nlearned mean_ :", scaler.mean_.round(4).tolist())
print("learned scale_:", scaler.scale_.round(4).tolist())
print("first age by hand:", round((df.loc[0, "Age"] - scaler.mean_[2]) / scaler.scale_[2], 8))Survived Pclass Age Fare 0 -0.789272 0.827377 -0.565736 -0.502445 1 1.266990 -1.566107 0.663861 0.786845 2 1.266990 0.827377 -0.258337 -0.488854 column means: [0.0, -0.0, 0.0, 0.0] column stds : [1.0, 1.0, 1.0, 1.0] learned mean_ : [0.3838, 2.3086, 29.3616, 32.2042] learned scale_: [0.4863, 0.8356, 13.0124, 49.6655] first age by hand: -0.56573646
Reading the standardised table
- Every column mean is 0 and every standard deviation is 1. That is the whole definition, and it holds for Survived and Pclass too, although neither is a measurement.
mean_andscale_are what the scaler learned: the four means and the four standard deviations of the input. They are the only state it carries, and they are what you must reuse on new data.- The first age is −0.56573646 whether it comes from the scaler or from the formula typed by hand. There is no hidden step.
- Negative values are normal. Half the rows of any column sit below its mean, so half the z scores are negative. A model has no difficulty with that.
Seeing the shape stay the same
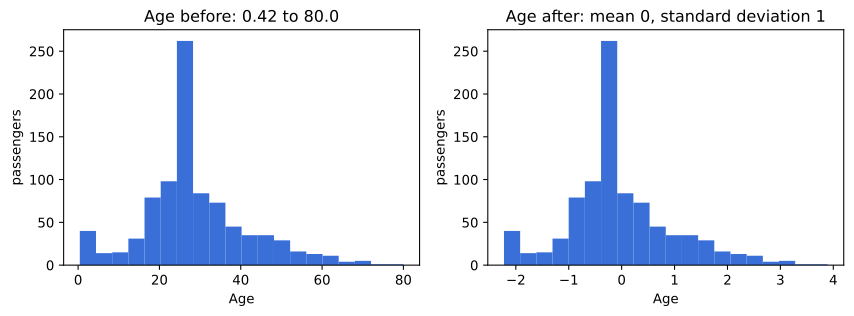
Standardisation moves and stretches a column. It does not change the shape of its distribution: a skewed column stays skewed, with new numbers on the axis.
import matplotlib.pyplot as plt

fig, ax = plt.subplots(1, 2, figsize=(9, 3.4))
ax[0].hist(df["Age"], bins=20, color="#3a6fd8")
ax[0].set_title("Age before: 0.42 to 80.0")
ax[1].hist(scaled["Age"], bins=20, color="#3a6fd8")
ax[1].set_title("Age after: mean 0, standard deviation 1")
for a in ax:
    a.set_xlabel("Age"); a.set_ylabel("passengers")
fig.tight_layout()

print("before: min %.2f  max %.2f  mean %.2f" % (df["Age"].min(), df["Age"].max(), df["Age"].mean()))
print("after : min %.2f max %.2f mean %.2f" % (scaled["Age"].min(), scaled["Age"].max(), scaled["Age"].mean()))before: min 0.42 max 80.00 mean 29.36 after : min -2.22 max 3.89 mean 0.00
fit, transform and fit_transform
These three calls are the interview question the video spends several minutes on, and they are the same three on every scikit-learn preprocessing object.
| Call | What it does | When |
|---|---|---|
fit(X) | learns the numbers, here the mean and standard deviation of each column, and returns the scaler | once, on the training rows |
transform(X) | applies the learned numbers and returns the changed data | on training rows, and later on every new row |
fit_transform(X) | both, in one pass over the training data | the usual call on the training set |
inverse_transform(X) | undoes the transform, back to the original units | when a prediction has to be read in real units |
Where standardisation is used
- As the default scaler. When nothing is known about the column's shape, standardisation is the safe first choice and the one most often seen in a pipeline.
- Before principal component analysis. The components follow the largest variance, and without standardisation the units decide which column that is.
- Before a model trained by gradient descent, which is linear regression, logistic regression and every neural network.
scale_ is the population standard deviation, computed with ddof=0, so it is not the number df['Age'].std() prints. On this column the scaler uses 13.012388 and pandas reports 13.019697. The difference is small, and the point is that the two are not the same quantity. Checking a scaled column with std() and seeing 1.000562 rather than 1.0 is this, not a bug.Related
- Previous: Which algorithms need scaling
- Next: Min max scaling
- See also: Robust scaling
- Reference: StandardScaler in the scikit-learn docs
- Call
scaler.inverse_transform(scaled)and compare the first row withdf.head(1). The original fares come back. - Remove
.set_output(transform='pandas')and tryscaled.head(). The error names the type you got instead. - Standardise before filling the missing ages. The 177 NaN rows survive the transform as NaN, and
mean_for Age becomes 29.6991, the mean of the 714 rows that have one.
You understood something today that you didn't yesterday.