
Dropping constant features
A constant feature is a column that holds the same value in every row, so it has zero variance and can tell a model nothing; VarianceThreshold finds and removes it.
Last updated: 12 Oct, 2026 · pandas 3.0 · scikit-learn 1.9
Why features are dropped showed what useless columns cost. The cheapest ones to find are those that never change, because they can be spotted without looking at the target at all.
Syntax: VarianceThreshold is a transformer like any other, with fit, transform and a mask of what it kept.
from sklearn.feature_selection import VarianceThreshold

selector = VarianceThreshold(threshold=0)   # 0 keeps anything that varies at all
selector.fit(X)
selector.get_support()                      # a boolean per column, True means kept
selector.get_feature_names_out()            # the names of the kept columns
Finding the columns that never change
A frame with two dead columns
Four columns, two of which hold one value throughout. C is all zeros and D is all ones, and neither can separate one row from another.
import pandas as pd

data = pd.DataFrame({"A": [1, 2, 4, 1, 2, 4],
                     "B": [4, 5, 6, 7, 8, 9],
                     "C": [0, 0, 0, 0, 0, 0],
"D": [1, 1, 1, 1, 1, 1]})import pandas as pd
from sklearn.feature_selection import VarianceThreshold
data = pd.DataFrame({"A": [1, 2, 4, 1, 2, 4],
"B": [4, 5, 6, 7, 8, 9],
"C": [0, 0, 0, 0, 0, 0],
"D": [1, 1, 1, 1, 1, 1]})
selector = VarianceThreshold(threshold=0).fit(data)
print("kept: ", selector.get_support())
print("names: ", list(selector.get_feature_names_out()))
print("dropped:", [c for c in data.columns if c not in selector.get_feature_names_out()])
print()
print("selector.variances_:", selector.variances_)
print("pandas data.var():")
print(data.var().to_string())kept: [ True True False False] names: ['A', 'B'] dropped: ['C', 'D'] selector.variances_: [1.55555556 2.91666667 0. 0. ] pandas data.var(): A 1.866667 B 3.500000 C 0.000000 D 0.000000
get_support()returns one boolean per column in the frame's order,Truefor kept. It is the mask every selector in this part shares.- C and D are dropped because their variance is exactly 0.
- The two variance numbers differ for A and B.
selector.variances_divides by n, which is the population variance; pandas.var()divides by n minus 1, which is the sample variance. For A that is 1.5556 against 1.8667. - The difference never changes the decision. Both are zero for a constant column and both are positive otherwise, so the mask is the same either way.
Returning a DataFrame instead of an array
Every scikit-learn transformer returns a NumPy array by default, which loses the column names. set_config(transform_output="pandas") makes every transformer in the session return a DataFrame instead, which saves rebuilding one by hand after each step.
from sklearn import set_config
from sklearn.feature_selection import VarianceThreshold

print("default output:")
print(VarianceThreshold(threshold=0).fit_transform(data)[:2])
set_config(transform_output="pandas")
print()
print("with transform_output='pandas':")
print(VarianceThreshold(threshold=0).fit_transform(data).head(2))default output: [[1 4] [2 5]] with transform_output='pandas': A B 0 1 4 1 2 5
Looking for constants in the house price data
A real dataset rarely has a column that is literally constant, and running the check anyway takes one line. The Ames house price data has 1460 rows and 81 columns.
import pandas as pd
from sklearn.feature_selection import VarianceThreshold

AMES = ("https://raw.githubusercontent.com/krishnaik06/"
        "Advanced-House-Price-Prediction-/master/train.csv")
df = pd.read_csv(AMES)
numeric = df.select_dtypes(include="number").drop(columns=["Id"])

selector = VarianceThreshold(threshold=0).fit(numeric.fillna(0))
dropped = [c for c in numeric.columns if c not in selector.get_feature_names_out()]
print("numeric columns:", numeric.shape[1])
print("zero variance: ", dropped)numeric columns: 37 zero variance: []
Nothing is dropped, which is the usual answer on a curated dataset and the reason this step is often skipped. It should not be: the useless columns are there, they are nearly constant rather than exactly constant, and VarianceThreshold at 0 cannot see them.
Finding near-constant columns
A column where one value covers 99 per cent of the rows is as useless as a constant for nearly every model, and it will not show up as zero variance. The share of the commonest value finds it, and unlike variance it works on text columns too.
share = df.apply(lambda s: s.value_counts(normalize=True, dropna=False).max())
quasi = share[share > 0.99].sort_values(ascending=False)share = df.apply(lambda s: s.value_counts(normalize=True, dropna=False).max())
quasi = share[share > 0.99].sort_values(ascending=False)
print(quasi.round(4).to_string())
print()
print("columns where one value covers over 95 per cent:", int((share > 0.95).sum()))
print()
print(df["Utilities"].value_counts().to_string())Utilities 0.9993 Street 0.9959 PoolArea 0.9952 PoolQC 0.9952 columns where one value covers over 95 per cent: 12 Utilities AllPub 1459 NoSeWa 1
Sorting those shares and drawing them puts the cut-off where it belongs, as a judgement about a continuous scale rather than a rule.
import matplotlib.pyplot as plt

top = share.sort_values(ascending=False).head(15)

plt.figure(figsize=(7, 5))
plt.barh(range(len(top)), top.values, color="#9370DB")
plt.yticks(range(len(top)), top.index)
plt.ylim(14.6, -1.8)                  # largest at the top, with room for the two labels
plt.axvline(0.99, color="#d64541", linestyle="--")
plt.axvline(0.95, color="#e08a1e", linestyle="--")
plt.text(0.99, -1.1, "0.99", color="#d64541", ha="center", fontsize=10)
plt.text(0.95, -1.1, "0.95", color="#e08a1e", ha="center", fontsize=10)
plt.xlim(0.5, 1.01)
plt.xlabel("share of rows holding the commonest value")
plt.title("The 15 least varied columns in the Ames data")
plt.show()
print("above 0.99:", int((share > 0.99).sum()), " above 0.95:", int((share > 0.95).sum()))above 0.99: 4 above 0.95: 12
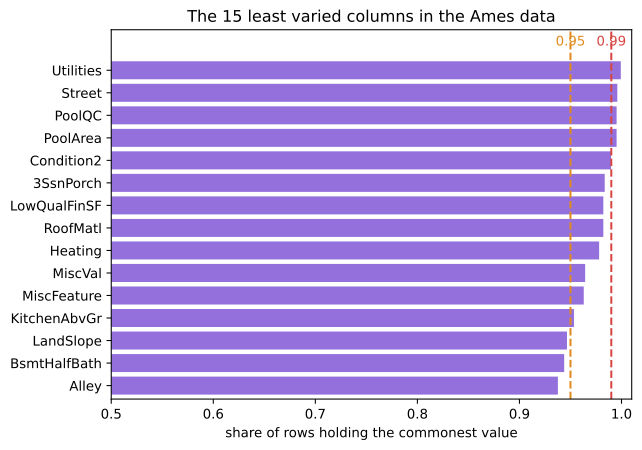
Utilitiesis the same value in 1459 of 1460 rows. One house differs. That column cannot help a model and will almost certainly be constant in any test split.- Twelve columns are over 95 per cent one value, including text columns that
VarianceThresholdcannot read at all. dropna=Falsecounts missing values as a value. Without it a column that is 99 per cent missing looks varied, because only the handful of real values are counted.- Where to draw the line is a decision, not a default. At 0.99 four columns go; at 0.95 twelve do, and some of those may still matter for a rare but important case.
Zero variance against near-constant
VarianceThreshold(0) | Share of the commonest value | |
|---|---|---|
| Finds | Columns with exactly one value | Columns with one dominant value |
| Works on text | No, it raises ValueError | Yes |
| Needs the target | No | No |
| Threshold | A variance, which depends on the column's scale | A share from 0 to 1, comparable across columns |
| On the Ames data | Drops nothing | Finds Utilities, Street and two more |
Where this check belongs
- First, before anything expensive. It needs no target and no model, so it costs one pass over the data.
- After one hot encoding. Encoding a column with a rare label creates a dummy that is 0 in 99.9 per cent of rows, and that dummy is exactly what this finds.
- As a data check, not only a selection step. A column that is suddenly constant in new data usually means a broken feed rather than a useless feature.
VarianceThreshold reads numbers only. Handing it a frame with a text column raises ValueError: could not convert string to float: 'RL'. Select the numeric columns first with select_dtypes(include="number"), and remember that a variance threshold above 0 is not comparable across columns on different scales, because variance carries the column's units squared.Related
- Previous: Why features are dropped
- Next: Dropping correlated features
- See also: One hot encoding with many categories
- Reference: VarianceThreshold in the scikit-learn API reference
- Set
VarianceThreshold(threshold=0.01)on the Ames numeric frame and list what it drops; then scale the frame withMinMaxScalerfirst and run it again to see how much the answer depends on units. - Lower the 0.99 in the near-constant check to 0.97 and read the extra columns it finds.
- Run the share check on
pd.get_dummies(df, dtype=int)and count how many dummy columns are over 99 per cent zero.
Slow is fine. Stopping is the only problem.