
Why features are dropped
Feature selection is choosing which of the columns you built are worth keeping, because a column that carries no signal still costs the model accuracy, time and trust.
Last updated: 12 Oct, 2026 · pandas 3.0 · scikit-learn 1.9
Every part before this one added columns. Cyclical encoding for hours and weekdays turned one hour column into two, one hot encoding turns one text column into dozens, and a date splits into five. A frame that started at 20 columns ends at 200, and most of them say nothing.
A useless column is not free. It is a direction the model can fit noise in, a split a tree can waste, and a line of code someone has to keep working in production.
Measuring what 200 useless columns cost
Building a frame of pure noise
The mobile price dataset has 20 real columns and a four-class target. Adding 200 columns of seeded random numbers gives a frame where exactly which columns matter is known in advance, so the damage can be measured rather than argued about.
import numpy as np
import pandas as pd

MOBILE = ("https://raw.githubusercontent.com/krishnaik06/"
          "Feature-Engineering-Live-sessions/master/mobile_dataset.csv")
df = pd.read_csv(MOBILE)
X = df.drop(columns="price_range")
y = df["price_range"]

rng = np.random.default_rng(0)                 # seeded, so the noise is the same every run
noise = pd.DataFrame(rng.normal(size=(len(X), 200)),
                     columns=[f"noise_{i}" for i in range(200)])
X_big = pd.concat([X, noise], axis=1)from sklearn.model_selection import train_test_split
from sklearn.ensemble import RandomForestClassifier
from sklearn.metrics import accuracy_score
for name, data in [("20 real columns", X), ("20 real + 200 noise", X_big)]:
X_train, X_test, y_train, y_test = train_test_split(
data, y, test_size=0.3, random_state=0, stratify=y)
model = RandomForestClassifier(n_estimators=100, random_state=0).fit(X_train, y_train)
print(f"{name:22s} {data.shape[1]:3d} columns"
f" test accuracy {accuracy_score(y_test, model.predict(X_test)):.4f}")20 real columns 20 columns test accuracy 0.8850 20 real + 200 noise 220 columns test accuracy 0.7033
- Test accuracy fell by about 18 points when 200 columns of pure noise were added. Not one row of information changed.
- A random forest is supposed to ignore useless columns, and mostly it does. What it cannot do is stop them being offered at every split, so some splits go to noise.
- The fit also takes several times longer, because every split considers a sample of 220 columns instead of 20.
Seeing where the importance went
A tree model reports how much each column reduced impurity across the forest. Summing that over the noise columns shows how much of the model's attention they took.
import pandas as pd
from sklearn.model_selection import train_test_split
from sklearn.ensemble import RandomForestClassifier

X_train, X_test, y_train, y_test = train_test_split(
    X_big, y, test_size=0.3, random_state=0, stratify=y)
model = RandomForestClassifier(n_estimators=100, random_state=0).fit(X_train, y_train)

importance = pd.Series(model.feature_importances_, index=X_big.columns)
print("share of importance on the 200 noise columns:",
      round(float(importance.filter(like="noise_").sum()), 4))
print()
print(importance.nlargest(6).round(4).to_string())share of importance on the 200 noise columns: 0.7819 ram 0.1530 battery_power 0.0121 px_width 0.0095 px_height 0.0092 mobile_wt 0.0061 noise_21 0.0053
- About 78 per cent of the importance sits on columns that are random numbers. Spread over 200 columns that is a small share each, and each small share is a real split somewhere.
- One noise column ranks sixth overall, above fifteen of the twenty real columns. Reading an importance ranking without selecting first is how a team ends up explaining a model by a column that means nothing.
ramstill comes first, so the signal survived. The question is how much was paid for keeping the junk beside it.
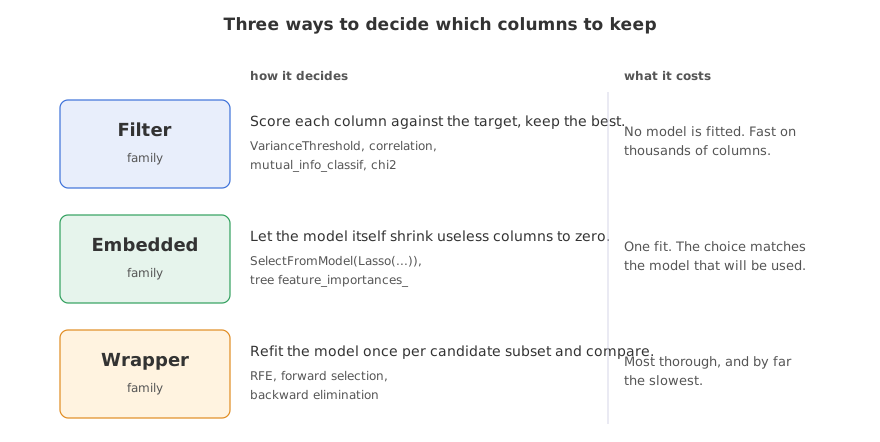
Filter, embedded and wrapper methods
| Family | How it decides | Cost | In this part |
|---|---|---|---|
| Filter | Scores each column on its own against the target, before any model is fitted | Cheap, and blind to how columns work together | Variance, correlation, mutual information, chi square |
| Embedded | The model's own fit shrinks or ignores useless columns | One fit, and the answer suits that model | Lasso through SelectFromModel |
| Wrapper | Refits the model once per candidate subset and keeps the best | The most thorough and by far the slowest | Named, not run |
This part covers the filter methods and the embedded one, in the order you would apply them: drop what is constant, drop what is duplicated, rank what is left, then let a model make the final cut. Wrapper methods such as RFE, forward selection and backward elimination follow the same idea at many times the cost, and scikit-learn ships RFE and SequentialFeatureSelector for them.
Where dropping columns pays
- Wide data. Gene expression, sensor arrays and one-hot encoded text reach thousands of columns on a few hundred rows, where a model can fit any target perfectly and predict nothing.
- A model someone has to explain. Twenty-one columns can be talked through with a business owner; eighty-two cannot.
- A model someone has to run. Every column kept is a field that must be collected, validated and served at prediction time, for as long as the model lives.
Related
- Previous: class_weight
- Next: Dropping constant features
- See also: Model based selection with Lasso
- Reference: Feature selection in the scikit-learn user guide
- Change the 200 noise columns to 20 and rerun. The accuracy loss shrinks, which shows the damage scales with how many useless columns are offered.
- Swap
RandomForestClassifierforLogisticRegression(max_iter=2000)and compare how much each model loses to the same noise. - Print
importance.nlargest(25)and count how many noise columns appear in the top 25.
You understood something today that you didn't yesterday.