
One hot encoding with many categories
One hot encoding a high cardinality column adds one column per level, so a column with dozens of levels turns a narrow frame into a wide and mostly empty one.
Last updated: 12 Oct, 2026 · pandas 3.0 · scikit-learn 1.9
One hot encoding cost one extra column for Sex and two for Embarked. This lesson runs the same call on a column with 44 levels and on the answer competition winners found for it.
Measuring the cost on a 44 level column
Two columns of a car dataset
The Mercedes-Benz manufacturing dataset has 378 columns; usecols loads two of them. X1 and X2 are anonymised production settings, which makes them the purest example of a nominal column with no order available anywhere.
df = pd.read_csv(URL, usecols=["X1", "X2"]) # 2 of the 378 columnsCounting the levels before encoding
nunique on each column is the one call worth making before any one hot encoding at all. It is the number of columns the encoding is about to add.
for column in df.columns:
    print(column, df[column].nunique(), "levels")
71 columns out of 2
import pandas as pd

URL = ("https://raw.githubusercontent.com/krishnaik06/Feature-Engineering-Live-sessions/"
       "master/mercedes.csv")
df = pd.read_csv(URL, usecols=["X1", "X2"])   # 2 of the 378 columns

print("shape:", df.shape)
for column in df.columns:
    print(column, df[column].nunique(), "levels")

print("get_dummies            :", pd.get_dummies(df, dtype=int).shape)
print("get_dummies drop_first :",
pd.get_dummies(df, drop_first=True, dtype=int).shape)shape: (4209, 2) X1 27 levels X2 44 levels get_dummies : (4209, 71) get_dummies drop_first : (4209, 69)
What 71 columns cost
- Two columns became 71. 27 levels in X1 and 44 in X2. With
drop_firstit is 69, which is a saving of 2 and not a solution. - Each new column is almost all zeros. A level that appears in 1 row of 4209 gives a column with one 1 in it, which no model can learn anything from.
- The frame is 4209 rows wide by 71 columns. Real catalogues have thousands of levels, and the same call on a postcode column produces a frame with more columns than rows.
- A tree cannot use them either. Splitting on a column that is 1 in four rows out of 4209 separates four rows, which is the shape of overfitting rather than of a useful rule.
How the levels are distributed
The counts are what makes the trick work. Plotting all 44 levels of X2 in order of frequency shows where the information in the column lives.
import matplotlib
matplotlib.use("svg")
import matplotlib.pyplot as plt
import pandas as pd

URL = ("https://raw.githubusercontent.com/krishnaik06/Feature-Engineering-Live-sessions/"
       "master/mercedes.csv")
df = pd.read_csv(URL, usecols=["X1", "X2"])
counts = df["X2"].value_counts()

print("top 5 :", counts.head(5).to_dict())
print("last 5:", counts.tail(5).to_dict())
print("levels appearing once:", int((counts == 1).sum()))
print("share of rows in the top 10:",
      round(counts.head(10).sum() / len(df) * 100, 1), "%")

fig, ax = plt.subplots(figsize=(7.5, 3))
colours = ["#9370DB"] * 10 + ["#c9c9d6"] * (len(counts) - 10)
ax.bar(range(len(counts)), counts.values, color=colours)
ax.set_xlabel("the 44 levels of X2, most frequent first")
ax.set_ylabel("rows")
fig.savefig("chart.svg")top 5 : {'as': 1659, 'ae': 496, 'ai': 415, 'm': 367, 'ak': 265}
last 5: {'l': 1, 'aa': 1, 'c': 1, 'o': 1, 'ar': 1}
levels appearing once: 8
share of rows in the top 10: 89.2 %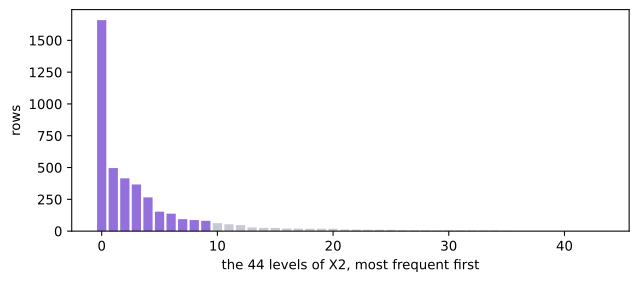
Reading the long tail
- One level covers 1659 of 4209 rows. The level named as covers 39% of the dataset on its own.
- The top ten levels cover 89.2% of the rows. The other 34 levels share the remaining 11%.
- Eight levels appear exactly once. Eight of the 44 columns one hot encoding would add hold a single 1 each.
- The shape is the usual one. Most real categorical columns look like this, which is why a rule that keeps the head and groups the tail works so widely.
Encoding only the ten most frequent levels
The trick is to make an indicator column for each of the ten most frequent levels and for no other level. A row whose level is outside the ten comes out as zeros across all ten, which is the same pattern a dropped level produces. It comes from the write-up of the KDD Cup 2009 Orange Challenge winners, and it costs ten columns per feature instead of 44.
import numpy as np
import pandas as pd

URL = ("https://raw.githubusercontent.com/krishnaik06/Feature-Engineering-Live-sessions/"
       "master/mercedes.csv")
df = pd.read_csv(URL, usecols=["X1", "X2"])

top_10 = list(df["X2"].value_counts().head(10).index)
print("top 10:", top_10)

for label in top_10:
    df["X2_" + label] = np.where(df["X2"] == label, 1, 0)

shown = ["X2", "X2_as", "X2_ae", "X2_n", "X2_e"]   # 4 of the 10 new columns
print(df[shown].head(6).to_string(index=False))
print("frame shape now:", df.shape)
covered = df["X2"].isin(top_10)
print("rows with a 1 somewhere:", int(covered.sum()),
" rows that are all zero:", int((~covered).sum()))top 10: ['as', 'ae', 'ai', 'm', 'ak', 'r', 'n', 's', 'f', 'e'] X2 X2_as X2_ae X2_n X2_e at 0 0 0 0 av 0 0 0 0 n 0 0 1 0 n 0 0 1 0 n 0 0 1 0 e 0 0 0 1 frame shape now: (4209, 12) rows with a 1 somewhere: 3754 rows that are all zero: 455
What the ten columns bought
- Ten columns instead of 44. The frame went from 2 columns to 12, and 34 near-empty columns were never created.
- 3754 rows carry a 1 and 455 do not. Those 455 rows hold one of the 34 rare levels, and all ten indicators are 0 for them.
- Rows 0 and 1 are both all zero. Their levels are at and av, which appear 6 and 4 times in 4209 rows. Row 2 is level n, which is in the top ten, so its X2_n column is 1.
- Every rare level now looks the same. at and av are indistinguishable after this encoding. That is the price, and on a level that appears 4 times it is a price worth paying.
A level that arrives for the first time after the model ships gets the same all-zero pattern, with no special handling, which is the second reason this trick is used. The scikit-learn version of the same idea is OneHotEncoder(max_categories=10) or min_frequency=, and it keeps the chosen levels inside the fitted object.
Full one hot vs the top ten
| Every level | Top ten only | |
|---|---|---|
| Columns added for X2 | 44 | 10 |
| Rare levels | one column each, nearly empty | merged into the all-zero pattern |
| Rows that are all zero | 0 | 455 of 4209 |
| A level seen for the first time later | no column exists for it | all ten are 0, which is a pattern the model has seen |
| Information kept | all of it | which of the common levels, and nothing finer |
Where a wide column turns up
- Postcode, city and country. Hundreds to thousands of levels, with most of the rows in a handful of them.
- Product, SKU and brand. A catalogue grows, so the level set is not even fixed.
- Free-text categories. A column people typed into carries misspellings and case variants as separate levels, which inflates the count before any real diversity does.
Related
- Previous: One hot encoding
- Next: Ordinal encoding
- See also: Count and frequency encoding
- Reference: sklearn.preprocessing.OneHotEncoder
- The top-ten trick: Winning the KDD Cup Orange Challenge with Ensemble Selection
- Change
head(10)tohead(3)and count how many rows come out all zero. - Run the same encoding on X1, which has 27 levels, and compare the share of rows the top ten cover.
- Replace the loop with
OneHotEncoder(max_categories=10, handle_unknown="infrequent_if_exist")and printget_feature_names_out().
Slow is fine. Stopping is the only problem.