
Target guided ordinal encoding
Target guided ordinal encoding ranks the categories of a column by the mean of the target inside each one, then replaces each category with its rank, so the order comes from the data rather than from a person.
Last updated: 12 Oct, 2026 · pandas 3.0 · scikit-learn 1.9
Count and frequency encoding gave every level a number that says how common it is. This one gives every level a number that says how the target behaves inside it, which is a much stronger claim and carries a cost to match.
The clip groups the cabin column by survival, sorts the result and takes the index, which is the whole technique in three calls.
Syntax: group, sort, number the result and map it back.
labels = df.groupby(column)[target].mean().sort_values().index
ranks = {name: i for i, name in enumerate(labels)}
df[column + "_rank"] = df[column].map(ranks)
Building the ranks for the cabin column
Cabin, cut down to its block letter
Cabin holds values like C85 and C123, which are seat numbers inside a block. 687 of the 891 rows have no cabin at all. Filling those with the word Missing and keeping the first character turns 148 near-unique values into nine levels.
df["Cabin"] = df["Cabin"].fillna("Missing")   # assign back, never inplace
df["Cabin"] = df["Cabin"].str[0]              # C85 and C123 both become C
The mean of the target inside each level
groupby plus mean on a 0 and 1 target gives the share of 1s in each group, which here is the survival rate of each cabin block.
means = df.groupby("Cabin")["Survived"].mean()Sorting, and numbering from zero
sort_values puts the worst-surviving level first and enumerate numbers the result. The codes start at 0; starting at 1 would shift every value by a constant and change nothing a model can see.
ranks = {name: i for i, name in enumerate(means.sort_values().index)}The nine cabin blocks, ranked by survival
import matplotlib
matplotlib.use("svg")
import matplotlib.pyplot as plt
import pandas as pd

URL = ("https://raw.githubusercontent.com/krishnaik06/Feature-Engineering-Live-sessions/"
       "master/titanic.csv")
df = pd.read_csv(URL, usecols=["Cabin", "Survived"])
df["Cabin"] = df["Cabin"].fillna("Missing")   # assign back, never inplace
df["Cabin"] = df["Cabin"].str[0]              # C85 and C123 both become C

means = df.groupby("Cabin")["Survived"].mean()
ranks = {name: i for i, name in enumerate(means.sort_values().index)}
df["Cabin_rank"] = df["Cabin"].map(ranks)

print(means.round(6).to_string())
print("ranks:", ranks)
print("rows per level:", df["Cabin"].value_counts().sort_index().to_dict())

ordered = means.sort_values()
fig, ax = plt.subplots(figsize=(7, 3))
ax.bar(ordered.index, ordered.values, color="#9370DB")
ax.axhline(df["Survived"].mean(), color="#d64541", linestyle="--",
           label="survival rate overall")
ax.set_xlabel("cabin block, in rank order")
ax.set_ylabel("survival rate")
ax.legend()
fig.savefig("chart.svg")Cabin
A 0.466667
B 0.744681
C 0.593220
D 0.757576
E 0.750000
F 0.615385
G 0.500000
M 0.299854
T 0.000000
ranks: {'T': 0, 'M': 1, 'A': 2, 'G': 3, 'C': 4, 'F': 5, 'B': 6, 'E': 7, 'D': 8}
rows per level: {'A': 15, 'B': 47, 'C': 59, 'D': 33, 'E': 32, 'F': 13, 'G': 4, 'M': 687, 'T': 1}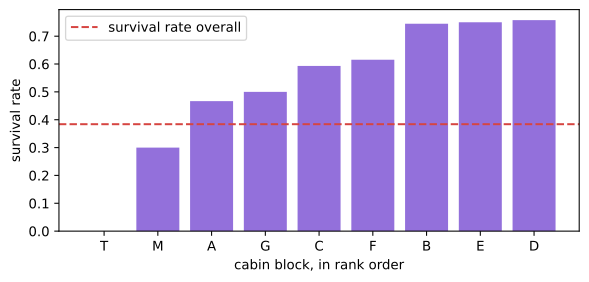
Reading the ranks
- M is the lowest real group at 0.2999, and it holds 687 rows. The word Missing cut down to its first letter, so M is every passenger with no cabin recorded. They survived at less than half the rate of any block, which makes the absence of the value a feature in its own right.
- T sits at 0.0 and holds one passenger. One row, who did not survive, so the group mean is exactly 0 and the rank 0 is built from a single observation.
- The order is T, M, A, G, C, F, B, E, D. The codes run 0 to 8 in that order, and D at 0.7576 is the highest.
- The ranks are a real order. Unlike the invented order on a nominal column, a higher rank here means a higher survival rate by construction, so a linear model can use the column as a single number.
The second point is the first crack. A level with one row gets a group mean of 0 or 1, which is the strongest possible signal built from the weakest possible evidence. The level counts, printed above, are the thing to look at before trusting any rank.
Using the ranks on rows the map was not built from
The ranks are a dictionary, so they can be saved and applied to any later frame. A level that is not a key in it comes back as NaN, which turns the column into a float and leaves a hole for the model. A fallback rank has to be chosen, and the middle of the range is the choice that claims the least.
import pandas as pd

URL = ("https://raw.githubusercontent.com/krishnaik06/Feature-Engineering-Live-sessions/"
       "master/titanic.csv")
df = pd.read_csv(URL, usecols=["Cabin", "Survived"])
df["Cabin"] = df["Cabin"].fillna("Missing").str[0]

means = df.groupby("Cabin")["Survived"].mean()
ranks = {name: i for i, name in enumerate(means.sort_values().index)}
df["Cabin_rank"] = df["Cabin"].map(ranks)
print(df.head(6).to_string(index=False))
print("dtype:", df["Cabin_rank"].dtype, " nulls:",
      int(df["Cabin_rank"].isnull().sum()))

later = pd.Series(["C", "Z", "M"])         # Z is a block the ranks never saw
print("new rows      :", later.map(ranks).tolist())
fallback = (len(ranks) - 1) / 2
print("with a fallback:", later.map(ranks).fillna(fallback).tolist()) Survived Cabin Cabin_rank
0 M 1
1 C 4
1 M 1
1 C 4
0 M 1
0 M 1
dtype: int64 nulls: 0
new rows : [4.0, nan, 1.0]
with a fallback: [4.0, 4.0, 1.0]What the encoded column looks like
- The first six rows read 1, 4, 1, 4, 1, 1. Four passengers with no cabin recorded, which is rank 1, and two in block C, which is rank 4.
- The column is an int64 with no nulls. Every one of the nine levels is a key in the dictionary, so nothing fell through.
- The later rows give 4, NaN and 1. Block Z was never in the training data, so there is no rank for it and the whole column turns into floats.
- The fallback is 4.0, the middle rank. It says the new block is neither good nor bad, which is all that is known about it. Filling with 0 instead would claim it is the worst block on the ship.
Where the ranks came from
Every rank was computed from the target column, over all 891 rows, including the rows the encoding is then written onto. The feature a model trains on therefore carries a summary of the answer for the rows it is training on. Mean encoding measures exactly how much that is worth and what to do about it, and Data leakage puts it in the wider picture.
Target guided ranks vs a rank you write
| Ordinal encoding | Target guided ordinal | |
|---|---|---|
| Where the order comes from | domain knowledge | the mean of the target per level |
| Needs a target | no | yes |
| Works on a nominal column | no, it invents an order | yes, the order is measured |
| Columns added | 1 | 1 |
| Reads the answer | no | yes, which is why it must be fitted on training rows only |
| A level seen for the first time later | NaN | NaN, so choose a fallback rank |
Where a target guided rank earns its place
- A nominal column with many levels and a clear target signal. Postcode against default rate, merchant against fraud rate, block against survival.
- Before a linear model. One ordered column is something a straight line can use, where 50 indicator columns are 50 coefficients fitted on little data each.
- When the level counts are healthy. A level with hundreds of rows gives a group mean worth ranking; a level with one row does not.
Related
- Previous: Count and frequency encoding
- Next: Mean encoding
- See also: Missing as its own category
- Reference: pandas groupby.mean
- Drop the levels with fewer than 10 rows before ranking and print the ranks again.
- Rank by
medianin place ofmeanand compare the two orders. - Remove the
fillna("Missing")line and count how many rows end up with no rank.
You understood something today that you didn't yesterday.