
The process, step by step
The feature engineering process is a fixed order of six steps: explore the data, handle the missing values, handle an imbalanced target, treat the outliers, scale the columns, and turn the categorical columns into numbers.
Last updated: 12 Oct, 2026 · pandas 3.0 · scikit-learn 1.9
Installation and setup put the libraries in place. This lesson is the map: what the steps are, why they run in this order, and which part of the course does each one. Every later lesson is one box in this picture.
Where the process sits in a project
A data science project runs as a sequence: feature engineering, then feature selection, then model creation, then hyperparameter tuning, then deployment, then incremental learning as new data arrives. Feature engineering is the first block and takes about 30% of the total time. Its goal is one sentence: turn raw data into useful data, so that a machine learning algorithm can ingest it.
The order matters because each step changes what the next one sees. Filling a column with its mean before looking for outliers uses a mean that the outliers have dragged upward. Scaling before encoding leaves the text columns unscaled. Resampling an imbalanced target before the outlier treatment duplicates the outliers along with everything else.
Step 1, exploring the data
The first step is EDA, and it is the one with a checklist:
- Count the numerical features, and draw each one as a histogram or a density curve, so the shape of the distribution is visible.
- Count the categorical features, and for each one count how many categories it holds. A column with four categories and a column with 9000 need different encoders.
- Find the missing values, per column, and visualise them rather than reading a wall of numbers.
- Find the outliers, with a box plot, one feature at a time.
- Write the observations down. The charts and what they show are the output of this step, and they are what gets sent to whoever asked for the analysis.
Parts two and three of this course are that checklist, from Reading a CSV that is not UTF-8 through to the charts.
Steps 2 to 6, in order
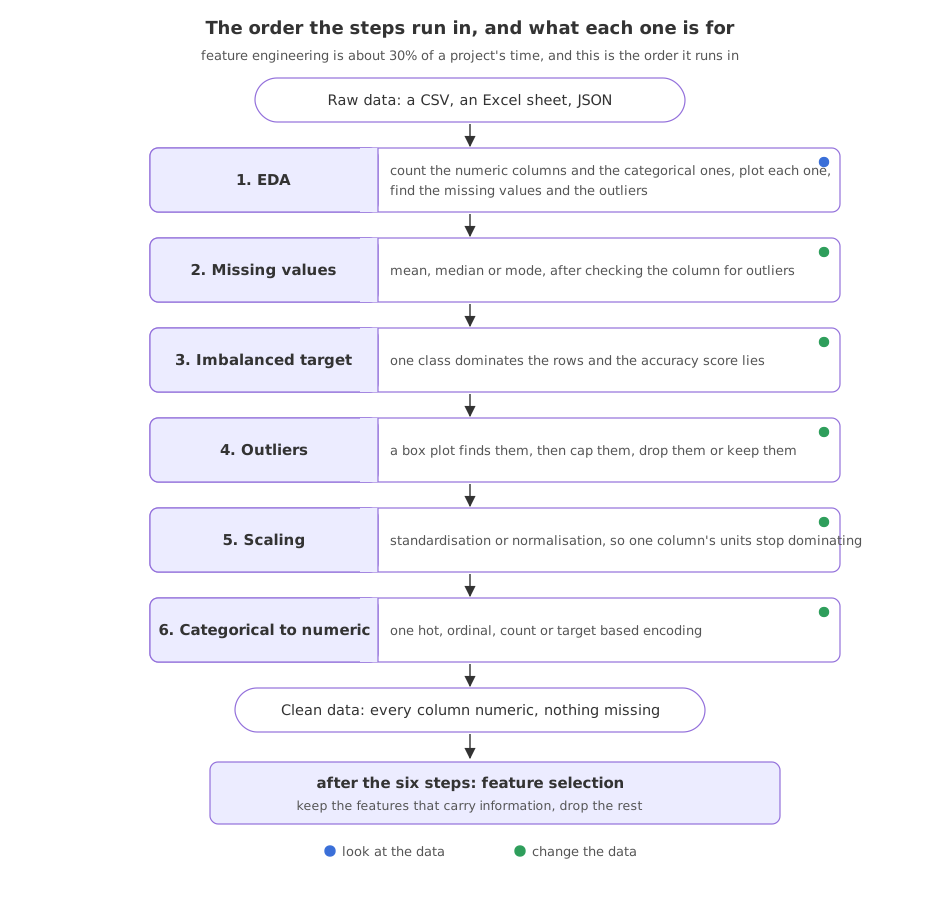
- Step 2, missing values. Fill them with the mean, the median or the mode, or with something else entirely. Which one depends on the column: analyse it for outliers first, because outliers pull a mean and leave a median alone.
- Step 3, an imbalanced target. When one class holds 99% of the rows, a model that always answers with that class scores 99% and has learned nothing. Not every algorithm copes, and the accuracy figure hides it.
- Step 4, outliers. Find them, then decide: cap them at a boundary, drop the rows or keep them. Which algorithms care is part of the decision.
- Step 5, scaling. Standardisation and normalisation put columns measured in different units onto a common footing, so a salary in rupees stops drowning an age in years.
- Step 6, categorical to numerical. The step with the most choices, because a column of four categories and a column of pin codes need different treatment.
Each of those steps is a part of this course, in the same order, and each lesson in them answers the same three questions: what the technique does, when it is the right choice, and what it costs.
What comes after the six steps
Once every column is numeric and nothing is missing, the data is clean and the model can be trained on it. One step sits between: feature selection, which keeps the features that carry information about the target and drops the rest. Correlation, chi square, mutual information and a model's own feature importances are the usual ways to decide, and the reason to bother is the curse of dimensionality, where more columns stop helping and start hurting.
One thing the six steps do not mention, and the eleventh part of this course is about, is that each of them must be fitted on the training rows alone. A median computed over the whole table, test rows included, has already leaked. Copy-on-write and chained assignment and the lessons after it build each technique; the leakage part puts them in the right order.
EDA vs feature engineering
| EDA | Feature engineering | |
|---|---|---|
| The question it answers | What is in this data | What should the model be given |
| What it changes | Nothing, the data is read only | The columns themselves |
| Its output | Charts and written observations | A table of numbers |
| Who reads the output | A person, often the analytics manager | A model |
| Where it goes wrong | Charts drawn with no question behind them | A transform fitted on data the model will not have at prediction time |
| In this course | Parts two and three | Parts four to eight |
Where this process is used
- A new dataset lands on your desk. The checklist is what stops the first hour turning into random plotting: counts, distributions, nulls, outliers, in that order.
- A model underperforms and the architecture is fine. Walking the six steps usually finds the reason, most often an unscaled column or a category encoded as if it were ordered.
- An interview asks how you would approach a dataset. The six steps, in order, with a reason for the order, is the answer.
Related
- Previous: Installation and setup
- Next: The datasets this course uses
- See also: EDA and Feature Engineering for the full lesson list
- Take a dataset you already have and run the step one checklist on it: how many numerical columns, how many categorical ones, how many categories inside the largest of them.
- For each of the six steps, write one sentence saying what would go wrong if you skipped it.
- Argue the opposite order for two of the steps, scaling before encoding for example, and say what breaks.
You understood something today that you didn't yesterday.