
Cyclical encoding for hours and weekdays
Cyclical encoding replaces a value that wraps round, such as an hour or a weekday, with its sine and cosine, so that the last value and the first sit next to each other.
Last updated: 12 Oct, 2026 · pandas 3.0 · scikit-learn 1.9 · openpyxl 3.1
When to drop a feature instead of engineering it left the flight table with Dept_hour as a plain number from 0 to 23. A model reading that column believes 23:00 and 00:00 are 23 apart, when they are one hour apart. Every column that wraps round has the same fault, and this is the fix.
The gap the plain column creates
The hour column is used by every model that measures a distance or fits a slope. Both read the difference between two numbers, and on a column that wraps round that difference is wrong exactly once per cycle, at the join.
import pandas as pd

BASE = ("https://raw.githubusercontent.com/krishnaik06/5-Days-Live-EDA-and-Featur"
        "e-Engineering/main/Flight%20Prediction/")
train = pd.read_excel(BASE + "Data_Train.xlsx")   # 10683 rows, Price included
test = pd.read_excel(BASE + "Test_set.xlsx")      # 2671 rows, no Price
flights = pd.concat([train, test], ignore_index=True)import pandas as pd
hour = pd.to_datetime(flights['Dep_Time'], format='%H:%M').dt.hour
for a, b in [(22, 23), (23, 0), (0, 1), (12, 13)]:
raw = abs(a - b)
real = min(raw, 24 - raw) # the shorter way round the clock
print(f"{a:3d} and {b:3d} the column says {raw:3d} the clock says {real:3d}")
print("\nlargest gap between neighbouring hours in the column:",
max(abs(h - (h + 1) % 24) for h in range(24)))22 and 23 the column says 1 the clock says 1 23 and 0 the column says 23 the clock says 1 0 and 1 the column says 1 the clock says 1 12 and 13 the column says 1 the clock says 1 largest gap between neighbouring hours in the column: 23
- Three of the four pairs are right. Neighbouring hours are one apart, as they should be.
- 23 and 0 come out 23 apart. They are one hour apart on a clock, and they are the two hours a late night pattern most needs to join up.
- That is the largest gap in the whole column, and it sits at the one place where the values are closest together in reality.
Putting the hours on a circle
A circle has no ends, so placing the 24 hours evenly round one removes the join. The position of each hour is then two numbers, how far round it is measured along one axis and along the other, which is exactly what the sine and the cosine give.
import numpy as np

# 2 * pi * h / 24 turns the hour into an angle: 0 at midnight, pi at noon
flights['Dept_hour_sin'] = np.sin(2 * np.pi * flights['Dept_hour'] / 24)
flights['Dept_hour_cos'] = np.cos(2 * np.pi * flights['Dept_hour'] / 24)
Both columns are needed. The sine alone cannot tell 6 from 18, because a sine takes the same value at both; the cosine separates them. Together they give every hour its own position, and the pair always satisfies sin squared plus cos squared equals 1.
Drawing the hours before and after
import matplotlib.pyplot as plt
import numpy as np

hours = np.arange(24)
sin = np.sin(2 * np.pi * hours / 24)
cos = np.cos(2 * np.pi * hours / 24)

fig, ax = plt.subplots(1, 2, figsize=(10, 4.2))
ax[0].plot(hours, np.zeros(24), 'o', color='#3a6fd8', ms=6)
ax[0].annotate('', xy=(23, -0.35), xytext=(0, -0.35),
               arrowprops=dict(arrowstyle='<->', color='#d64541'))
ax[0].text(11.5, -0.55, 'the plain column puts them 23 apart', ha='center', color='#d64541')
ax[0].set_ylim(-0.8, 0.5); ax[0].set_yticks([]); ax[0].set_xticks([0, 6, 12, 18, 23])
ax[0].set_xlabel('Dept_hour as a plain number'); ax[0].set_title('one column')
ax[1].plot(sin, cos, 'o', color='#3a6fd8', ms=6)
for h in (0, 23):
    ax[1].plot([sin[h]], [cos[h]], 'o', color='#d64541', ms=9)
    ax[0].plot([h], [0], 'o', color='#d64541', ms=9)
    ax[0].annotate(str(h), (h, 0), xytext=(0, 14), textcoords='offset points',
                   ha='center', color='#d64541')
for side in ('left', 'right', 'top'):
    ax[0].spines[side].set_visible(False)
for h in (0, 6, 12, 18, 23):
    ax[1].annotate(str(h), (sin[h], cos[h]), xytext=(10, 6), textcoords='offset points')
ax[1].set_aspect('equal'); ax[1].set_xlabel('Dept_hour_sin'); ax[1].set_ylabel('Dept_hour_cos')
ax[1].set_title('two columns'); ax[1].margins(0.22)
fig.tight_layout()

print("sin of the first four hours:", sin[:4].round(4).tolist())
print("cos of the first four hours:", cos[:4].round(4).tolist())
print("sin squared plus cos squared:", np.unique((sin ** 2 + cos ** 2).round(10)).tolist())sin of the first four hours: [0.0, 0.2588, 0.5, 0.7071] cos of the first four hours: [1.0, 0.9659, 0.866, 0.7071] sin squared plus cos squared: [1.0]
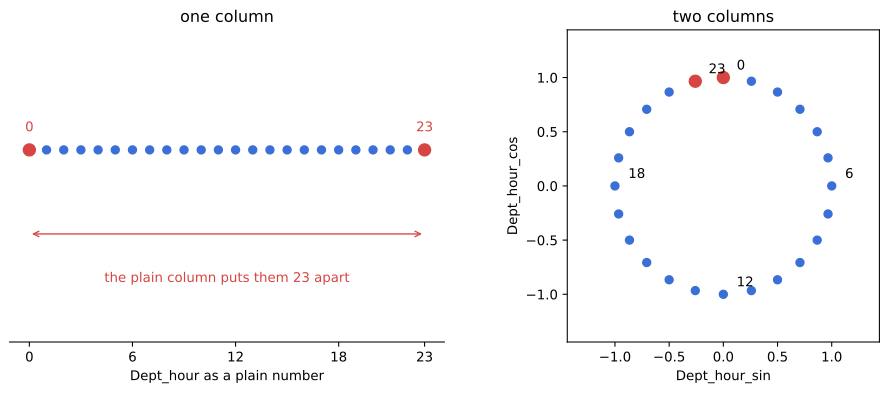
Measuring the gap the two columns give
The proof is in what a distance now says. For each hour, the five nearest others are listed twice: once from the plain column, once from the sine and cosine pair.
import numpy as np

hours = np.arange(24)
sin = np.sin(2 * np.pi * hours / 24)
cos = np.cos(2 * np.pi * hours / 24)
target = 23

plain = np.abs(hours - target)
cyclical = np.hypot(sin - sin[target], cos - cos[target])

print("five hours nearest to 23")
print("  from the plain column :", hours[np.argsort(plain, kind='stable')][1:6].tolist())
print("  from sin and cos      :", hours[np.argsort(cyclical, kind='stable')][1:6].tolist())

for a, b in [(23, 0), (23, 22), (11, 13), (0, 12)]:
    gap = np.hypot(sin[a] - sin[b], cos[a] - cos[b])
print(f"{a:3d} and {b:3d} plain {abs(a - b):3d} cyclical {gap:.4f}")five hours nearest to 23 from the plain column : [22, 21, 20, 19, 18] from sin and cos : [22, 0, 21, 1, 20] 23 and 0 plain 23 cyclical 0.2611 23 and 22 plain 1 cyclical 0.2611 11 and 13 plain 2 cyclical 0.5176 0 and 12 plain 12 cyclical 2.0000
- The plain column says the neighbours of 23 are 22, 21, 20, 19, 18. Everything after midnight is invisible to it.
- The pair says 22 and 0, then 21 and 1, then 20. The clock is joined up, and each hour is now as close to the one before it as to the one after it.
- 23 and 0 come out at 0.2611, the same as 23 and 22. Two hours that are one step apart on the clock are one step apart in the data.
- 0 and 12 come out at 2.0, the largest possible distance, which is the diameter of the circle. Midnight and noon are as far apart as two hours can be.
The same encoding for a weekday
Any column that wraps round takes the same pair, with the length of its own cycle in place of the 24: seven for a weekday, twelve for a month of the year, twelve again for a clock face, 365 for a day of the year.
import numpy as np
import pandas as pd

when = pd.to_datetime(flights['Date_of_Journey'], format='%d/%m/%Y')
weekday = when.dt.weekday                      # Monday 0 ... Sunday 6
flights['Weekday_sin'] = np.sin(2 * np.pi * weekday / 7)
flights['Weekday_cos'] = np.cos(2 * np.pi * weekday / 7)

days = np.arange(7)
s, c = np.sin(2 * np.pi * days / 7), np.cos(2 * np.pi * days / 7)
print("Sunday to Monday   plain", abs(6 - 0), "  cyclical", round(float(np.hypot(s[6] - s[0], c[6] - c[0])), 4))
print("Monday to Tuesday  plain", abs(0 - 1), "  cyclical", round(float(np.hypot(s[0] - s[1], c[0] - c[1])), 4))
print("\nfirst three rows:")
print(flights[['Weekday_sin', 'Weekday_cos']].head(3).round(4).to_string())Sunday to Monday plain 6 cyclical 0.8678 Monday to Tuesday plain 1 cyclical 0.8678 first three rows: Weekday_sin Weekday_cos 0 -0.7818 0.6235 1 0.9749 -0.2225 2 -0.7818 0.6235
- Sunday to Monday reads 6 in the plain column and 0.8678 after the encoding.
- Monday to Tuesday reads 1 and the same 0.8678. Every pair of neighbouring days is now the same distance apart, which is what a weekday means.
- The two new columns replace the one, so the weekday costs two features instead of one, or instead of six if it had been one hot encoded.
Three ways to encode an hour
| Plain number 0 to 23 | One hot, 24 columns | Sine and cosine | |
|---|---|---|---|
| Columns | 1 | 23 after dropping one | 2 |
| 23 next to 0 | no, 23 apart | yes, every pair is equally far | yes, one step apart |
| Keeps the order | yes | no | yes |
| Works for a tree | yes, trees split on thresholds | yes | yes, but the split is harder to read |
| Works for KNN and a linear model | only away from the join | loses the order | yes |
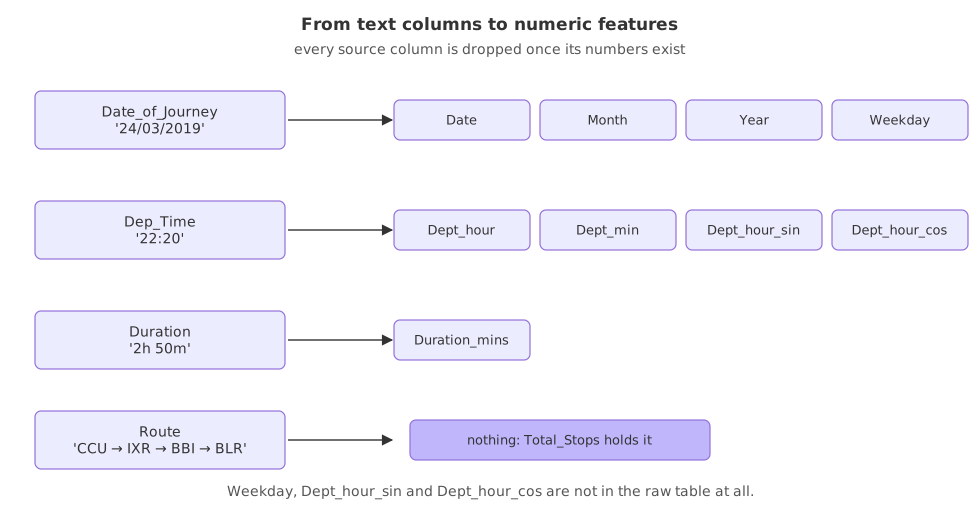
The whole flight table, column by column
With the sine and cosine pair the chapter is finished. Four text columns went in and nine numeric features came out, two of which were in no column of the raw table.
Where cyclical encoding is used
- Hour of the day and day of the week, in demand, traffic and fraud models, where late night behaviour runs across midnight.
- Month and day of the year, where December and January are one month apart and a plain month number makes them eleven.
- Any angle, such as a wind direction in degrees, where 359 and 1 are two degrees apart.
Related
- Previous: When to drop a feature instead of engineering it
- Next: What imbalance does to a model
- See also: One hot encoding
- Reference: Time related feature engineering in the scikit-learn docs
- Encode the hour with a cycle of 12 instead of 24 and look at the circle. Morning and evening land on top of each other, which is what a clock face does.
- Keep only
Dept_hour_sinand list the hours nearest to 6. The pairing with 18 appears at once. - Build the same pair for
Dept_minon a cycle of 60 and check whether the nearest neighbours of minute 55 now include minute 0.
You understood something today that you didn't yesterday.